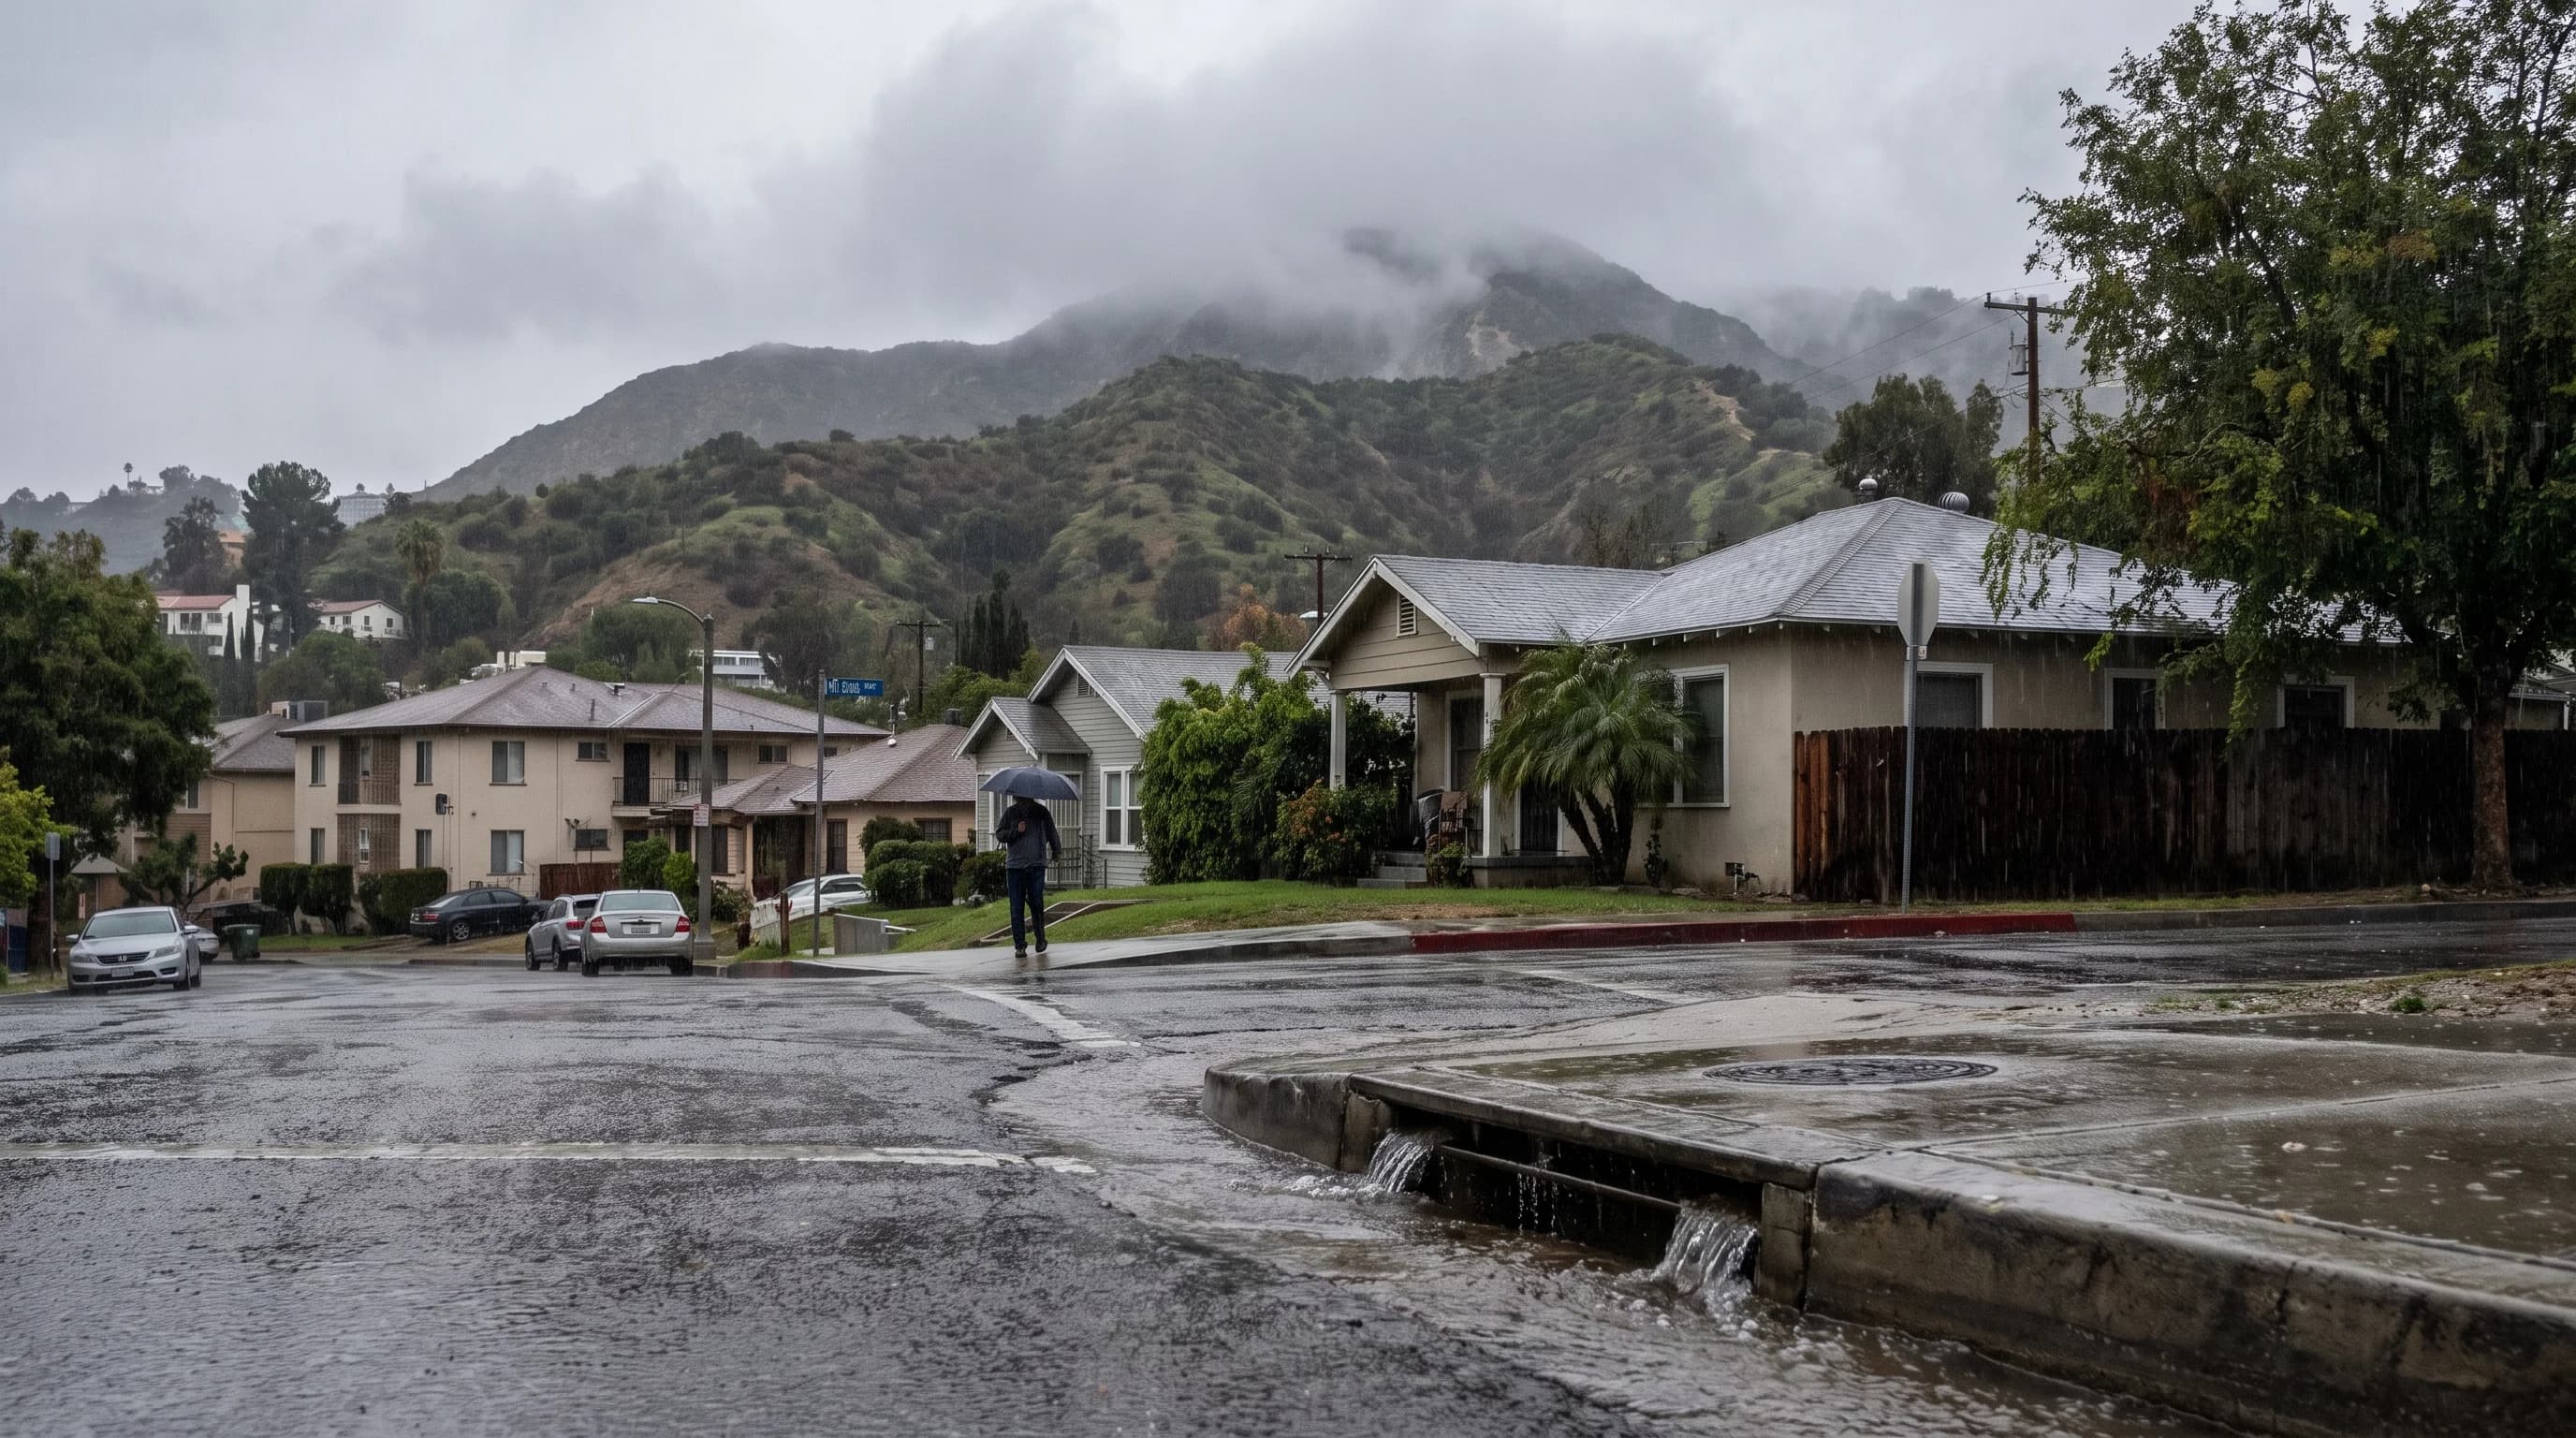
A wet Los Angeles winter is a handful of strong storms, not weeks of steady rain. Five to eight multi-day Pacific storms between December and March typically deliver most of the season's rain in concentrated bursts. Between storms, the LA Basin can go two or three weeks with clear skies and no measurable rain. A winter feels wet because of how many storms arrive, how strong each one is and whether they hit Southern California instead of sliding north toward Oregon and Washington.
What Makes a Los Angeles Winter Unusually Wet?
A Los Angeles winter is wet when the season's rain runs well above the NOAA 1991-2020 normal, not when one big storm makes it feel rainy. Downtown Los Angeles averages 14.25 inches of rain per October-to-September water year, according to NOAA climate normals, and most of it falls from December through March. Monthly totals, this season's total and records are in Los Angeles rainfall totals, and other cities are compared in Southern California rainfall totals by city. 14.25 inches is less than half of what Seattle or Atlanta gets, which is why Angelenos notice rain so much when a storm arrives.
Los Angeles rain comes in concentrated bursts. The LA Basin sits at the dry southern edge of the Pacific storm track, so most winters get their rain from a few strong storms, not a steady series of weak fronts. Homeowners can capture winter rain in barrels; see California rainwater collection rules. For the current statewide picture, see is California still in a drought.
One strong storm sequence in January or February can move a season from below normal to well above normal in a week. That volatility makes year-to-year comparisons more useful than any one storm's headlines. For neighborhood forecasts and rain totals, including Downtown Los Angeles and Pasadena, use the National Weather Service Los Angeles/Oxnard office, which covers the LA Basin, Ventura County and nearby mountains and coast.
| Month | Typical role in the season | What residents usually notice |
|---|---|---|
| October to November | Season onset, usually light | First fronts arrive; totals are typically the lowest of the wet months |
| December | Storm frequency increases | First multi-day systems and first mountain snow of the season |
| January | Climatological peak | Typically the wettest single month at most low-elevation stations |
| February | Peak season continues | Frequently rivals January for the season's most active storm stretch |
| March | Late-season storms still likely | Can still deliver a major system even as spring warmth returns |
| April to June | Rapid tapering | Occasional light system, then a long dry stretch into fall |
Dry and wet years see rain in about the same number of months. Both usually get light rain from October through spring. The difference is how many strong storms land from December through March and how much moisture each carries. Two winters can look the same through mid-December and end completely differently by February, depending on where that season's storm track aims.
Which Pacific Storm Patterns Actually Deliver LA's Rain?
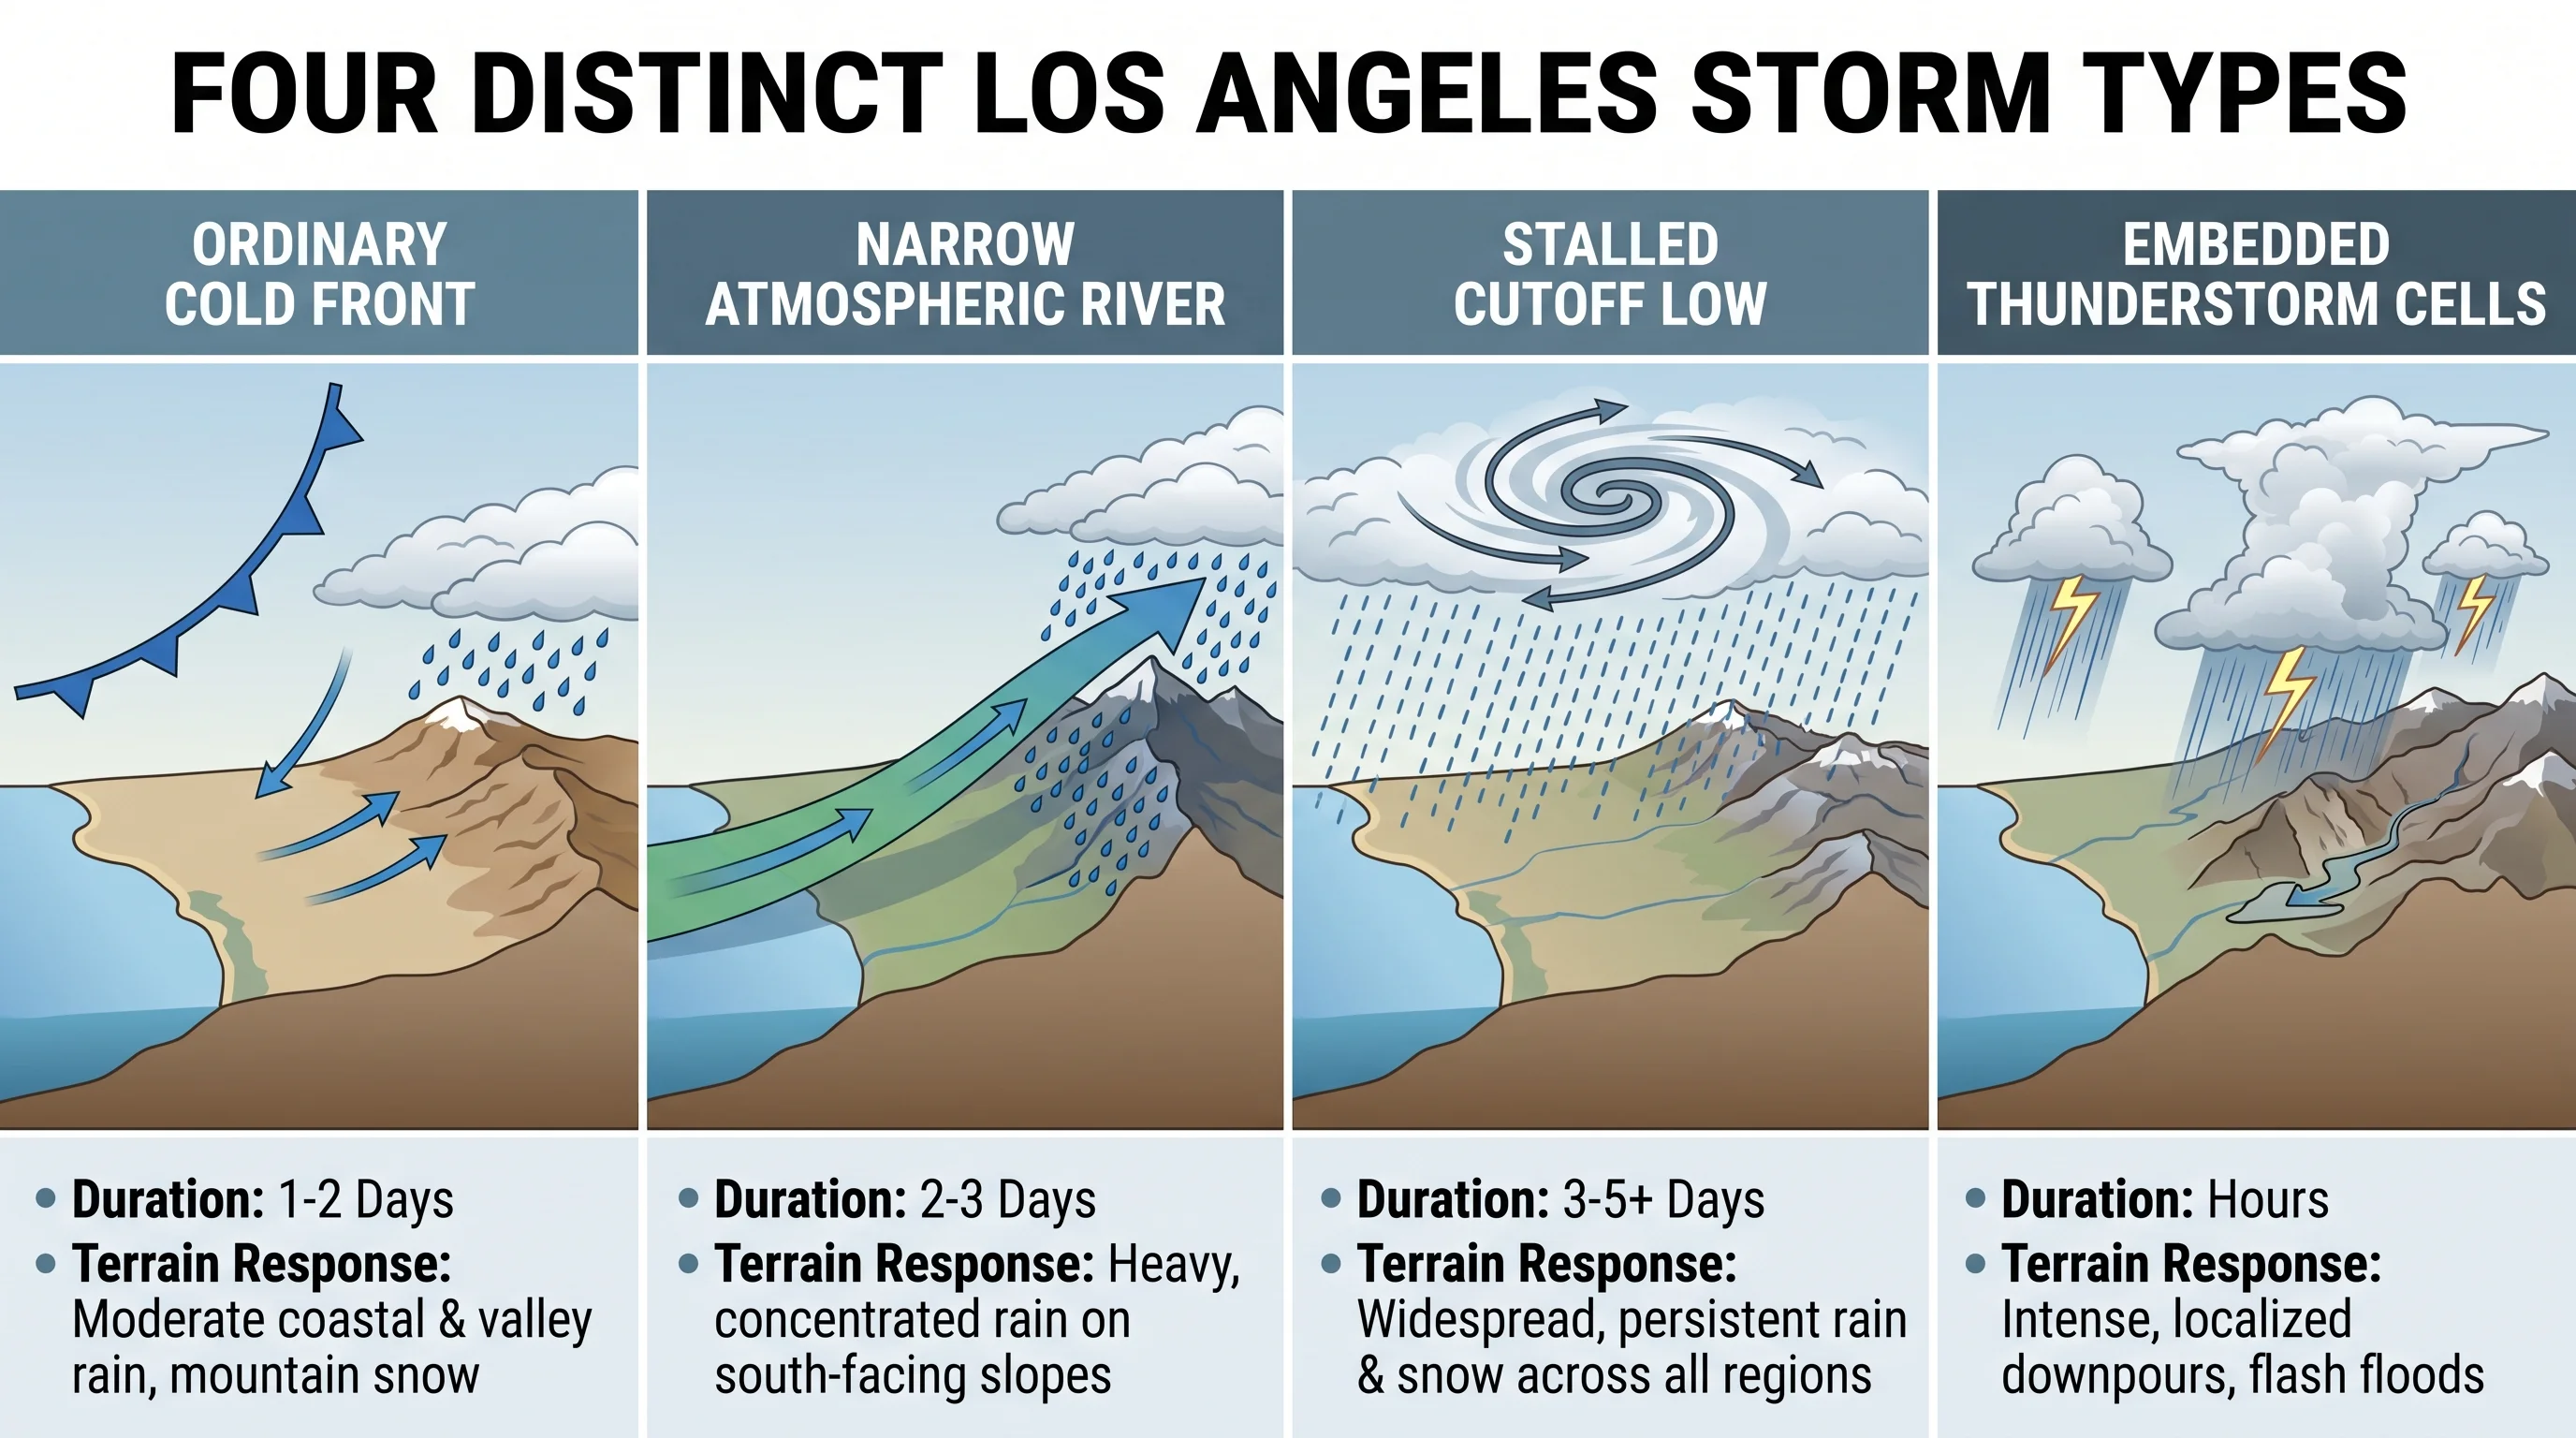
Four storm types bring Los Angeles its rain, and each behaves differently. Ordinary cold fronts are the most common: a band of moderate rain passes in 12 to 24 hours, often followed by gusty wind, then clears. Atmospheric rivers are narrow plumes of concentrated tropical or subtropical moisture that can bring heavy rain for two or three days. Atmospheric rivers produce most of Southern California's largest storm totals, as what are atmospheric rivers in Southern California explains.
Cutoff lows are the third type. A cutoff low is a slow-moving upper-level low that breaks away from the jet stream and can stall near Southern California for days, bringing long, cool rain without an atmospheric river's intense moisture. A warm atmospheric river with moisture from near Hawaii is called a Pineapple Express.
Embedded thunderstorms are the fourth: individual storm cells inside a larger front that pour rain much faster than the surrounding storm. They can trigger flash flood warnings even when the larger storm looks ordinary. Not every heavy-rain storm is an atmospheric river, and the four types differ in duration, intensity and hazards.
Why Do Rain Totals Vary So Much Across Coast, Basin, and Mountains?
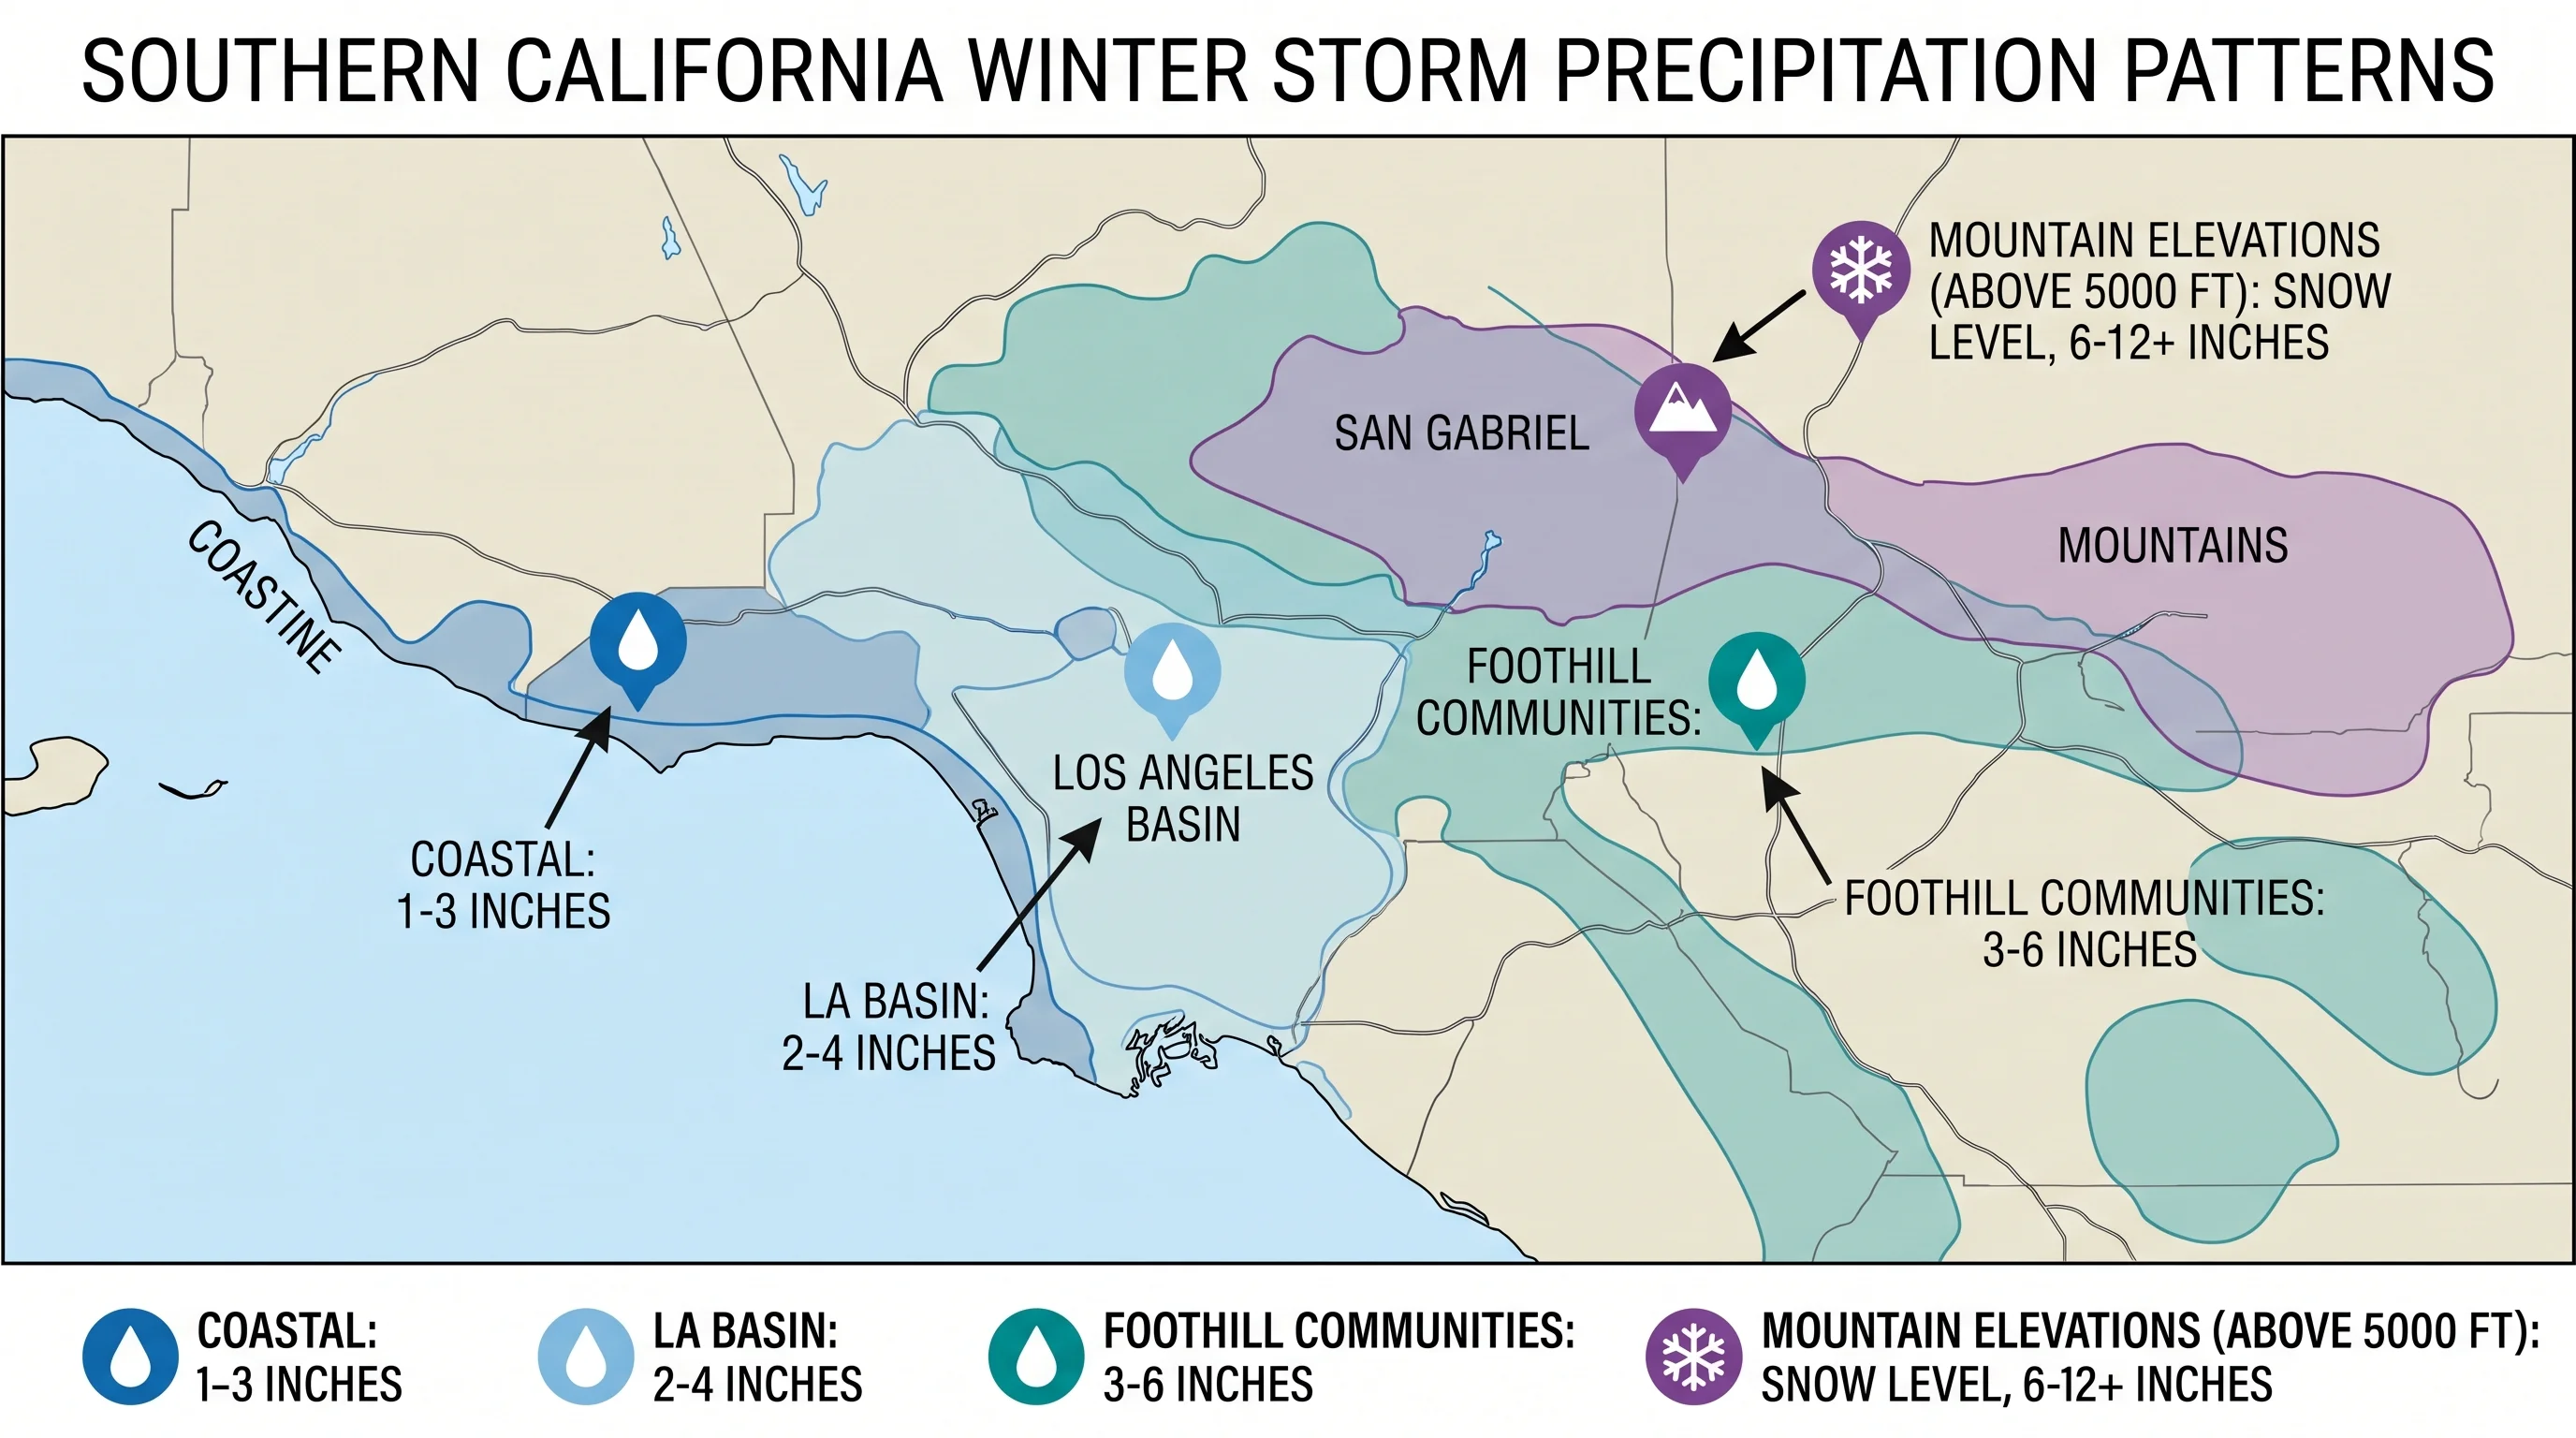
Rain totals vary across the coast, basin and mountains because of terrain, storm direction and rain shadows, and the same storm can drop very different totals within 20 miles. Moist air moving inland hits the San Gabriel and San Bernardino Mountains, rises, cools and drops extra rain on south- and west-facing slopes. Meteorologists call this orographic lift. Foothill cities like Pasadena often get more rain than flatter basin areas in the same storm because they sit at the base of that terrain.
Storm direction also changes the pattern. A storm from the southwest favors the coast and south-facing slopes. A storm from the northwest favors the mountains and inland valleys. The downwind side of a mountain range often sits in a rain shadow and gets much less rain than the windward slope a few miles away.
Inland valleys such as Woodland Hills can land on either side of that divide depending on the storm's track. One seasonal average for Los Angeles hides those differences. To see how unevenly a storm behaved, compare station totals for the same storm over the same period.
How Do El Niño and the Jet Stream Shape a Wet Season?
El Niño and La Niña shift the odds for a Southern California winter without guaranteeing any outcome. During El Niño, warmer water in the equatorial Pacific usually pushes the subtropical jet stream south and strengthens it across California. That raises the chance of a wetter-than-normal season with more storms aimed at Southern California. La Niña usually does the reverse, favoring a drier winter as storms shift toward the Pacific Northwest and high pressure lingers over Southern California.
El Niño and La Niña are probability shifts driven by long-lasting ocean temperature patterns, not on-off switches. For how each phase forms and how forecasters track it, see El Niño vs. La Niña: what's the difference for a SoCal winter.
El Niño or La Niña helps predict a season, not a specific week. Some of Southern California's wettest winters happened in strong El Niño years, including the 1997-98 winter that gave LA its wettest February. Strong La Niña winters have still brought flooding atmospheric rivers. The jet stream's position in a given week, which shifts over days, decides whether a storm hits Los Angeles or passes by, and a seasonal outlook cannot predict that.
When Does a Wet Winter Turn Hazardous?
A wet winter turns hazardous when rain rates or totals exceed what local terrain, drainage and soil can handle. In Los Angeles that threshold is lower than in wetter climates because of steep canyons, recent burn scars and heavily paved streets. The National Weather Service issues a separate product for each risk. Urban and small stream flood watches and warnings cover street and creek flooding; why does Los Angeles flood so fast explains why LA floods faster than most cities.
Recent burn scars carry a separate and often deadlier risk: debris flows. Burned soil stops absorbing water, so rain runs off fast and carries mud, rock and vegetation downhill with little warning. The National Weather Service issues debris flow warnings for burn areas, and USGS landslide hazard research shows that the rain rate needed to trigger a debris flow on a burn scar can be a fraction of what an unburned hillside handles. For why LA hillsides fail after rain, see mudslides in Los Angeles: why the hills give way after rain.
The same storm often brings high surf advisories on the coast, high wind warnings on exposed ridges and passes and winter storm warnings for the San Gabriel and San Bernardino Mountains above about 5,000 to 6,000 feet, all at once.
How Should You Track the Next LA Storm?
To track the next LA storm, start with the rainfall forecast and any watches or warnings from NWS Los Angeles/Oxnard, or the NWS San Diego office for areas farther south. Those products turn a storm forecast into what each neighborhood should expect. The Weather Prediction Center shows an incoming storm's moisture and strength days before it arrives. For mountain travel, check the forecast snow level, which can shift by a thousand feet or more and decides whether the San Gabriels get rain or several feet of snow.
Radar shows what is falling right now and helps with short-term timing, but it does not replace the official forecast discussion and alerts. Before or during a storm, review the NWS flood safety guidance for what each watch and warning means, especially if you live near a canyon, creek or recent burn scar. Rain totals, radar and alerts change within hours, so always check their timestamps.
Every LA winter follows the same basic pattern: long dry stretches broken by a few intense multi-day storms, very different totals at the coast, basin and mountains from the same storm, and El Niño or La Niña shifting the odds without deciding any week. Before the next storm, check rain timing and totals, snow level, wind, surf, burn-scar alerts and road conditions on WeatherLA's Los Angeles forecast pages for Downtown Los Angeles, Pasadena, Woodland Hills or your destination.