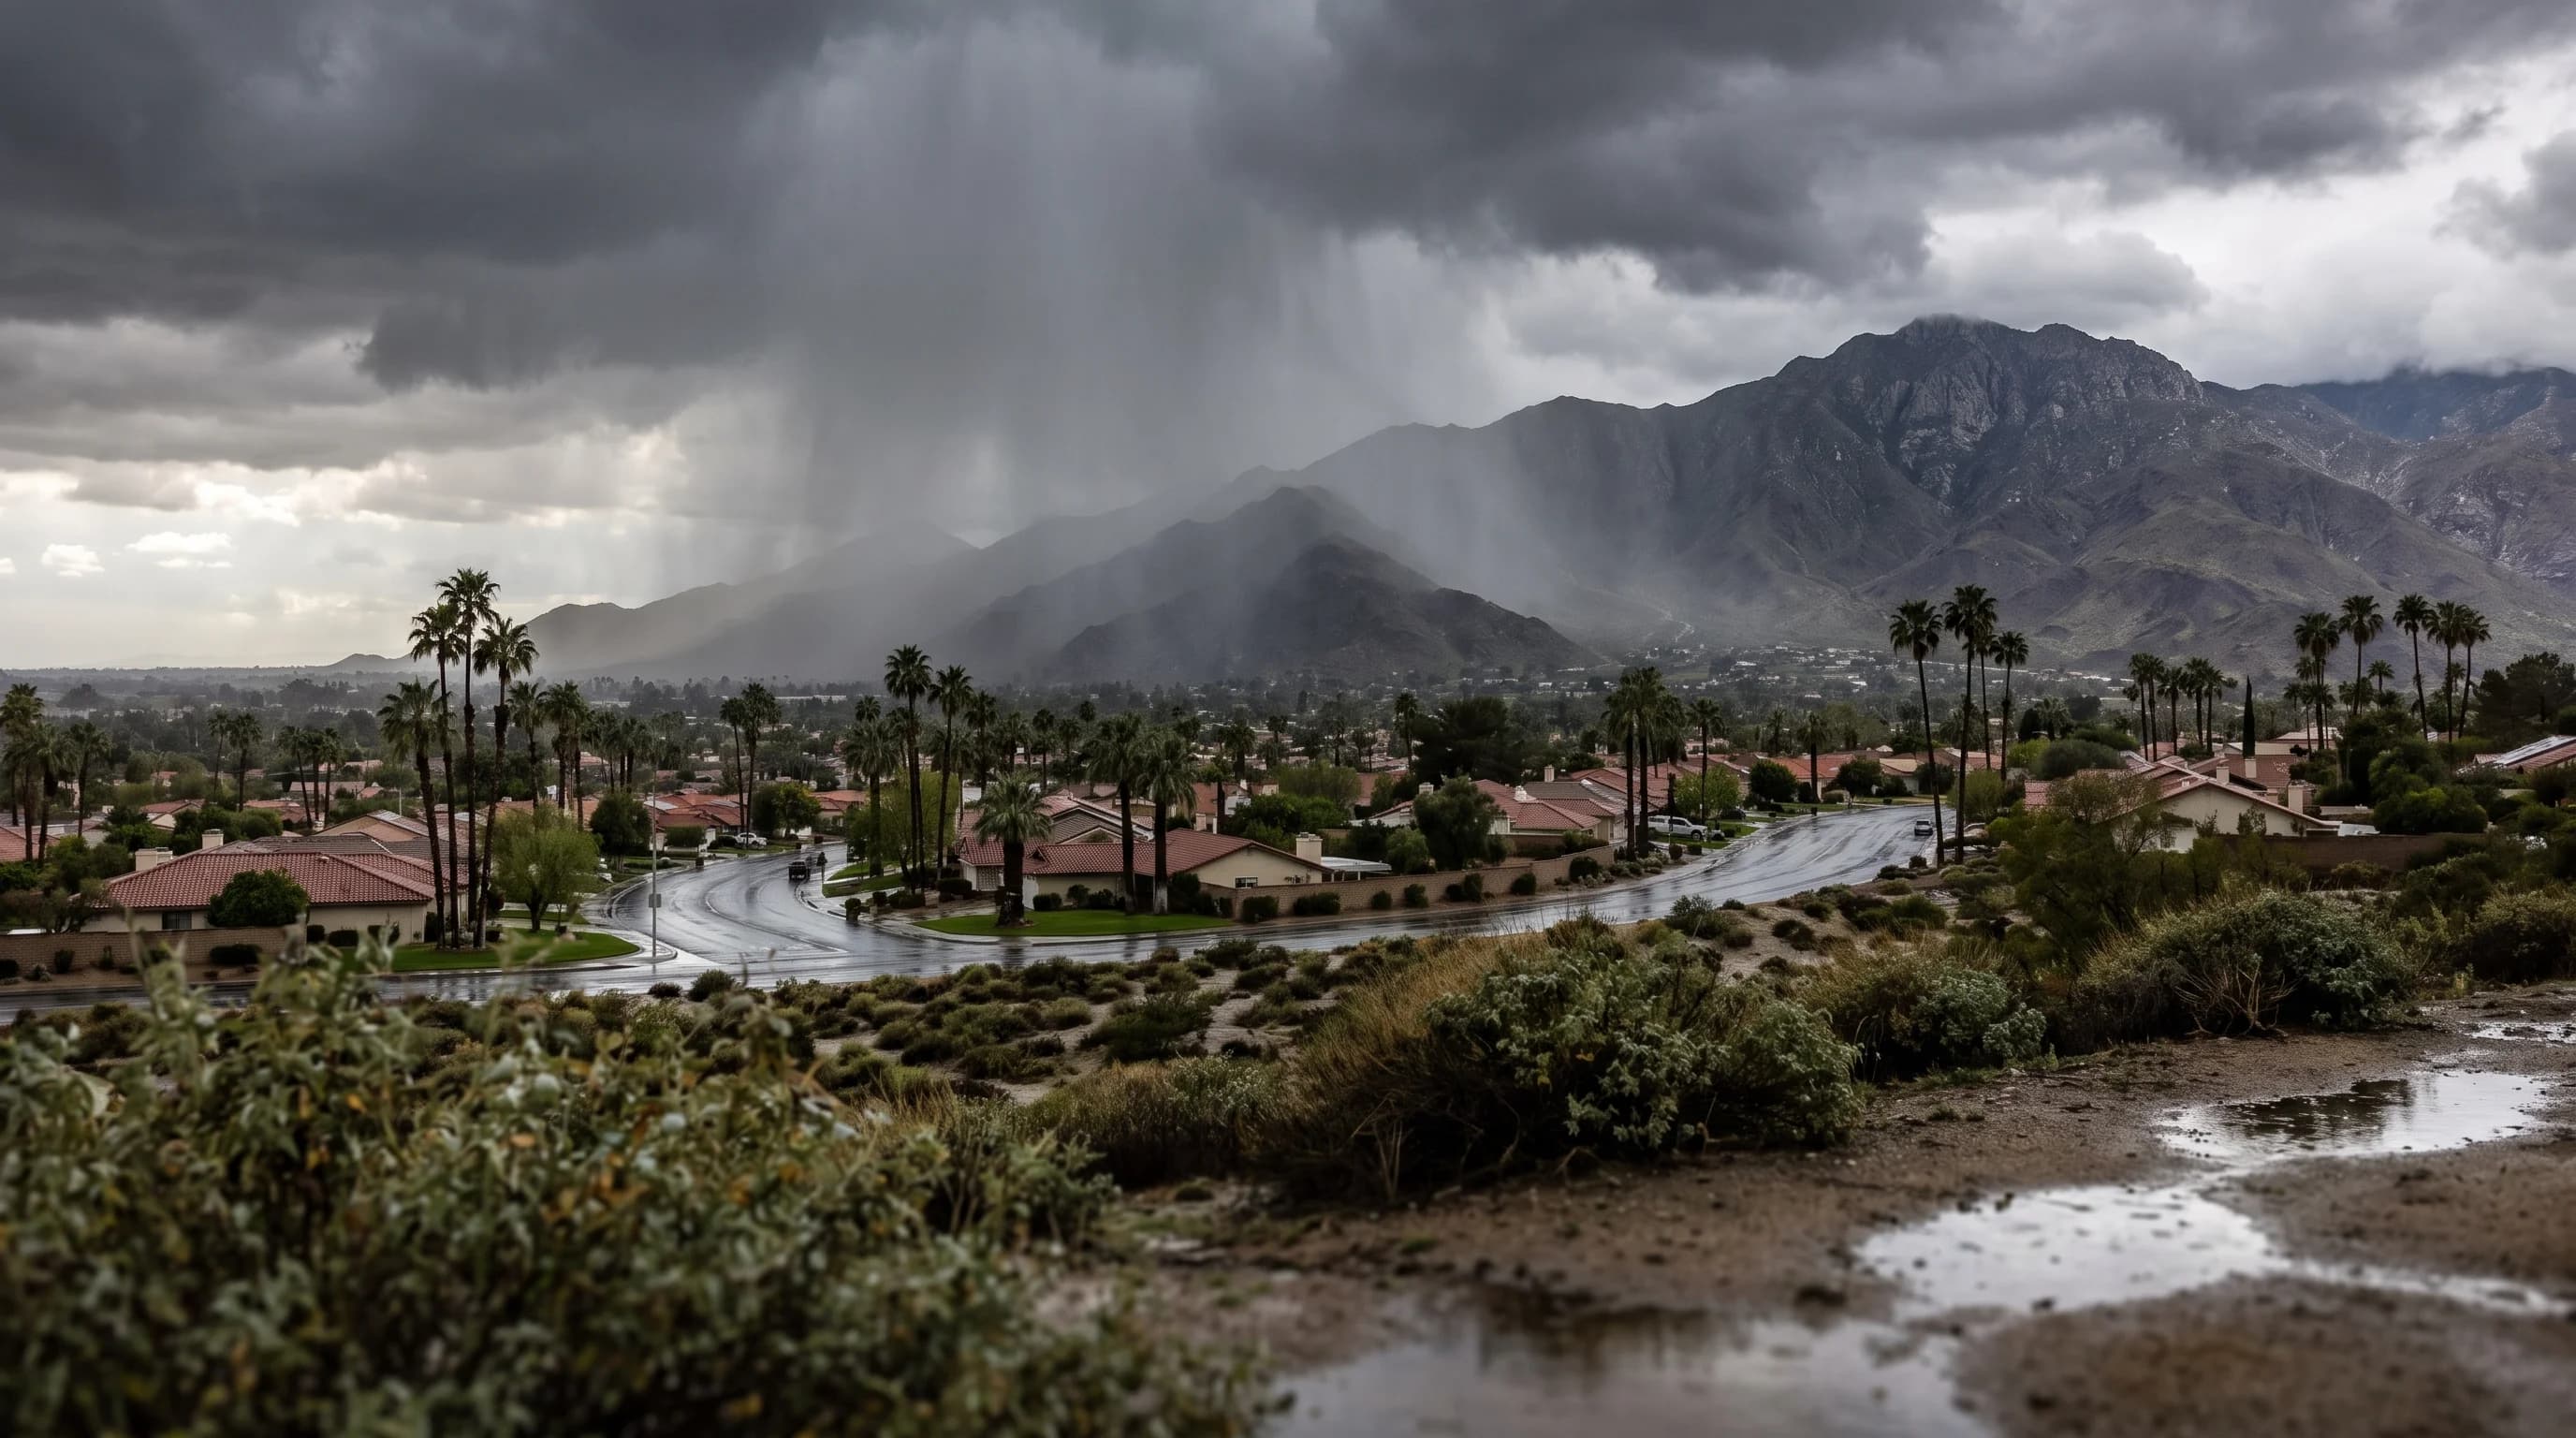
Southern California rainfall rises from south to north and from the coast into the foothills. San Diego averages 9.79 inches a year, LAX 12.23, Downtown Los Angeles 14.25, Santa Barbara 17.25 and Pasadena 20.08.
The deserts get far less: Palmdale averages 5.90 inches and Palm Springs 4.61. Mountain gauges get the most, with Mt. Wilson averaging 32.17 inches.
Southern California's rainfall averages hide how uneven a single storm can be. In the February 2024 atmospheric river, the gauge at UCLA caught 12.49 inches over five days, including 10.40 inches in one day, its wettest day in records going back to 1933.
LAX, about 9 miles away, got 5.68 inches. San Diego got 2.43. All three totals came from the same storm in the same week. In Southern California, the answer to "how much rain did we get?" depends on where you are.
How Much Rain Does Each Southern California City Get?
Southern California cities get about 10 to 20 inches of rain a year, and far less in the deserts. The San Diego coast and the Inland Empire get roughly 10 inches. The Los Angeles basin and Orange County get 12 to 14 inches, and the west San Fernando Valley, Santa Barbara and the San Gabriel foothills get 16 to 20. The deserts get under 6. The table lists each station's 1991-2020 normal and what it got in 2022-23, the wettest season of the past decade across most of the region. Totals use October-to-September water years, the calendar the National Weather Service uses.
| Station | Area | Normal (1991-2020) | Wet year (2022-23) |
|---|---|---|---|
| Palm Springs | Desert | 4.61 | 7.03 |
| Palmdale | High desert | 5.90 | 10.22 |
| Riverside | Inland Empire | 9.37 | 15.67 |
| San Diego | Coast | 9.79 | 15.76 |
| Ontario | Inland Empire | 11.64 | 24.58 |
| Hawthorne | LA basin | 11.77 | 24.41 |
| Fullerton | Orange County | 11.86 | 23.38 |
| Long Beach | Coast | 12.02 | 23.75 |
| LAX | Coast | 12.23 | 26.46 |
| Avalon (Catalina) | Island | 12.77 | 23.86 |
| Oxnard | Coast | 12.93 | 23.13 |
| Van Nuys | San Fernando Valley | 13.42 | 32.98 |
| Santa Monica | Coast | 13.45 | 28.36 |
| Anaheim | Orange County | 13.52 | 26.28 |
| Burbank | San Fernando Valley | 13.91 | 30.49 |
| Culver City | LA basin | 14.05 | 35.87 |
| Downtown LA | LA basin | 14.25 | 31.07 |
| Woodland Hills | San Fernando Valley | 16.41 | 36.59 |
| Santa Barbara | Coast | 17.25 | 28.95 |
| UCLA (Westwood) | Foothills | 17.73 | 40.37 |
| Big Bear Lake | Mountains | 19.98 | 44.49 |
| Pasadena | Foothills | 20.08 | 47.88 |
| Mt. Wilson | Mountains | 32.17 | n/a |
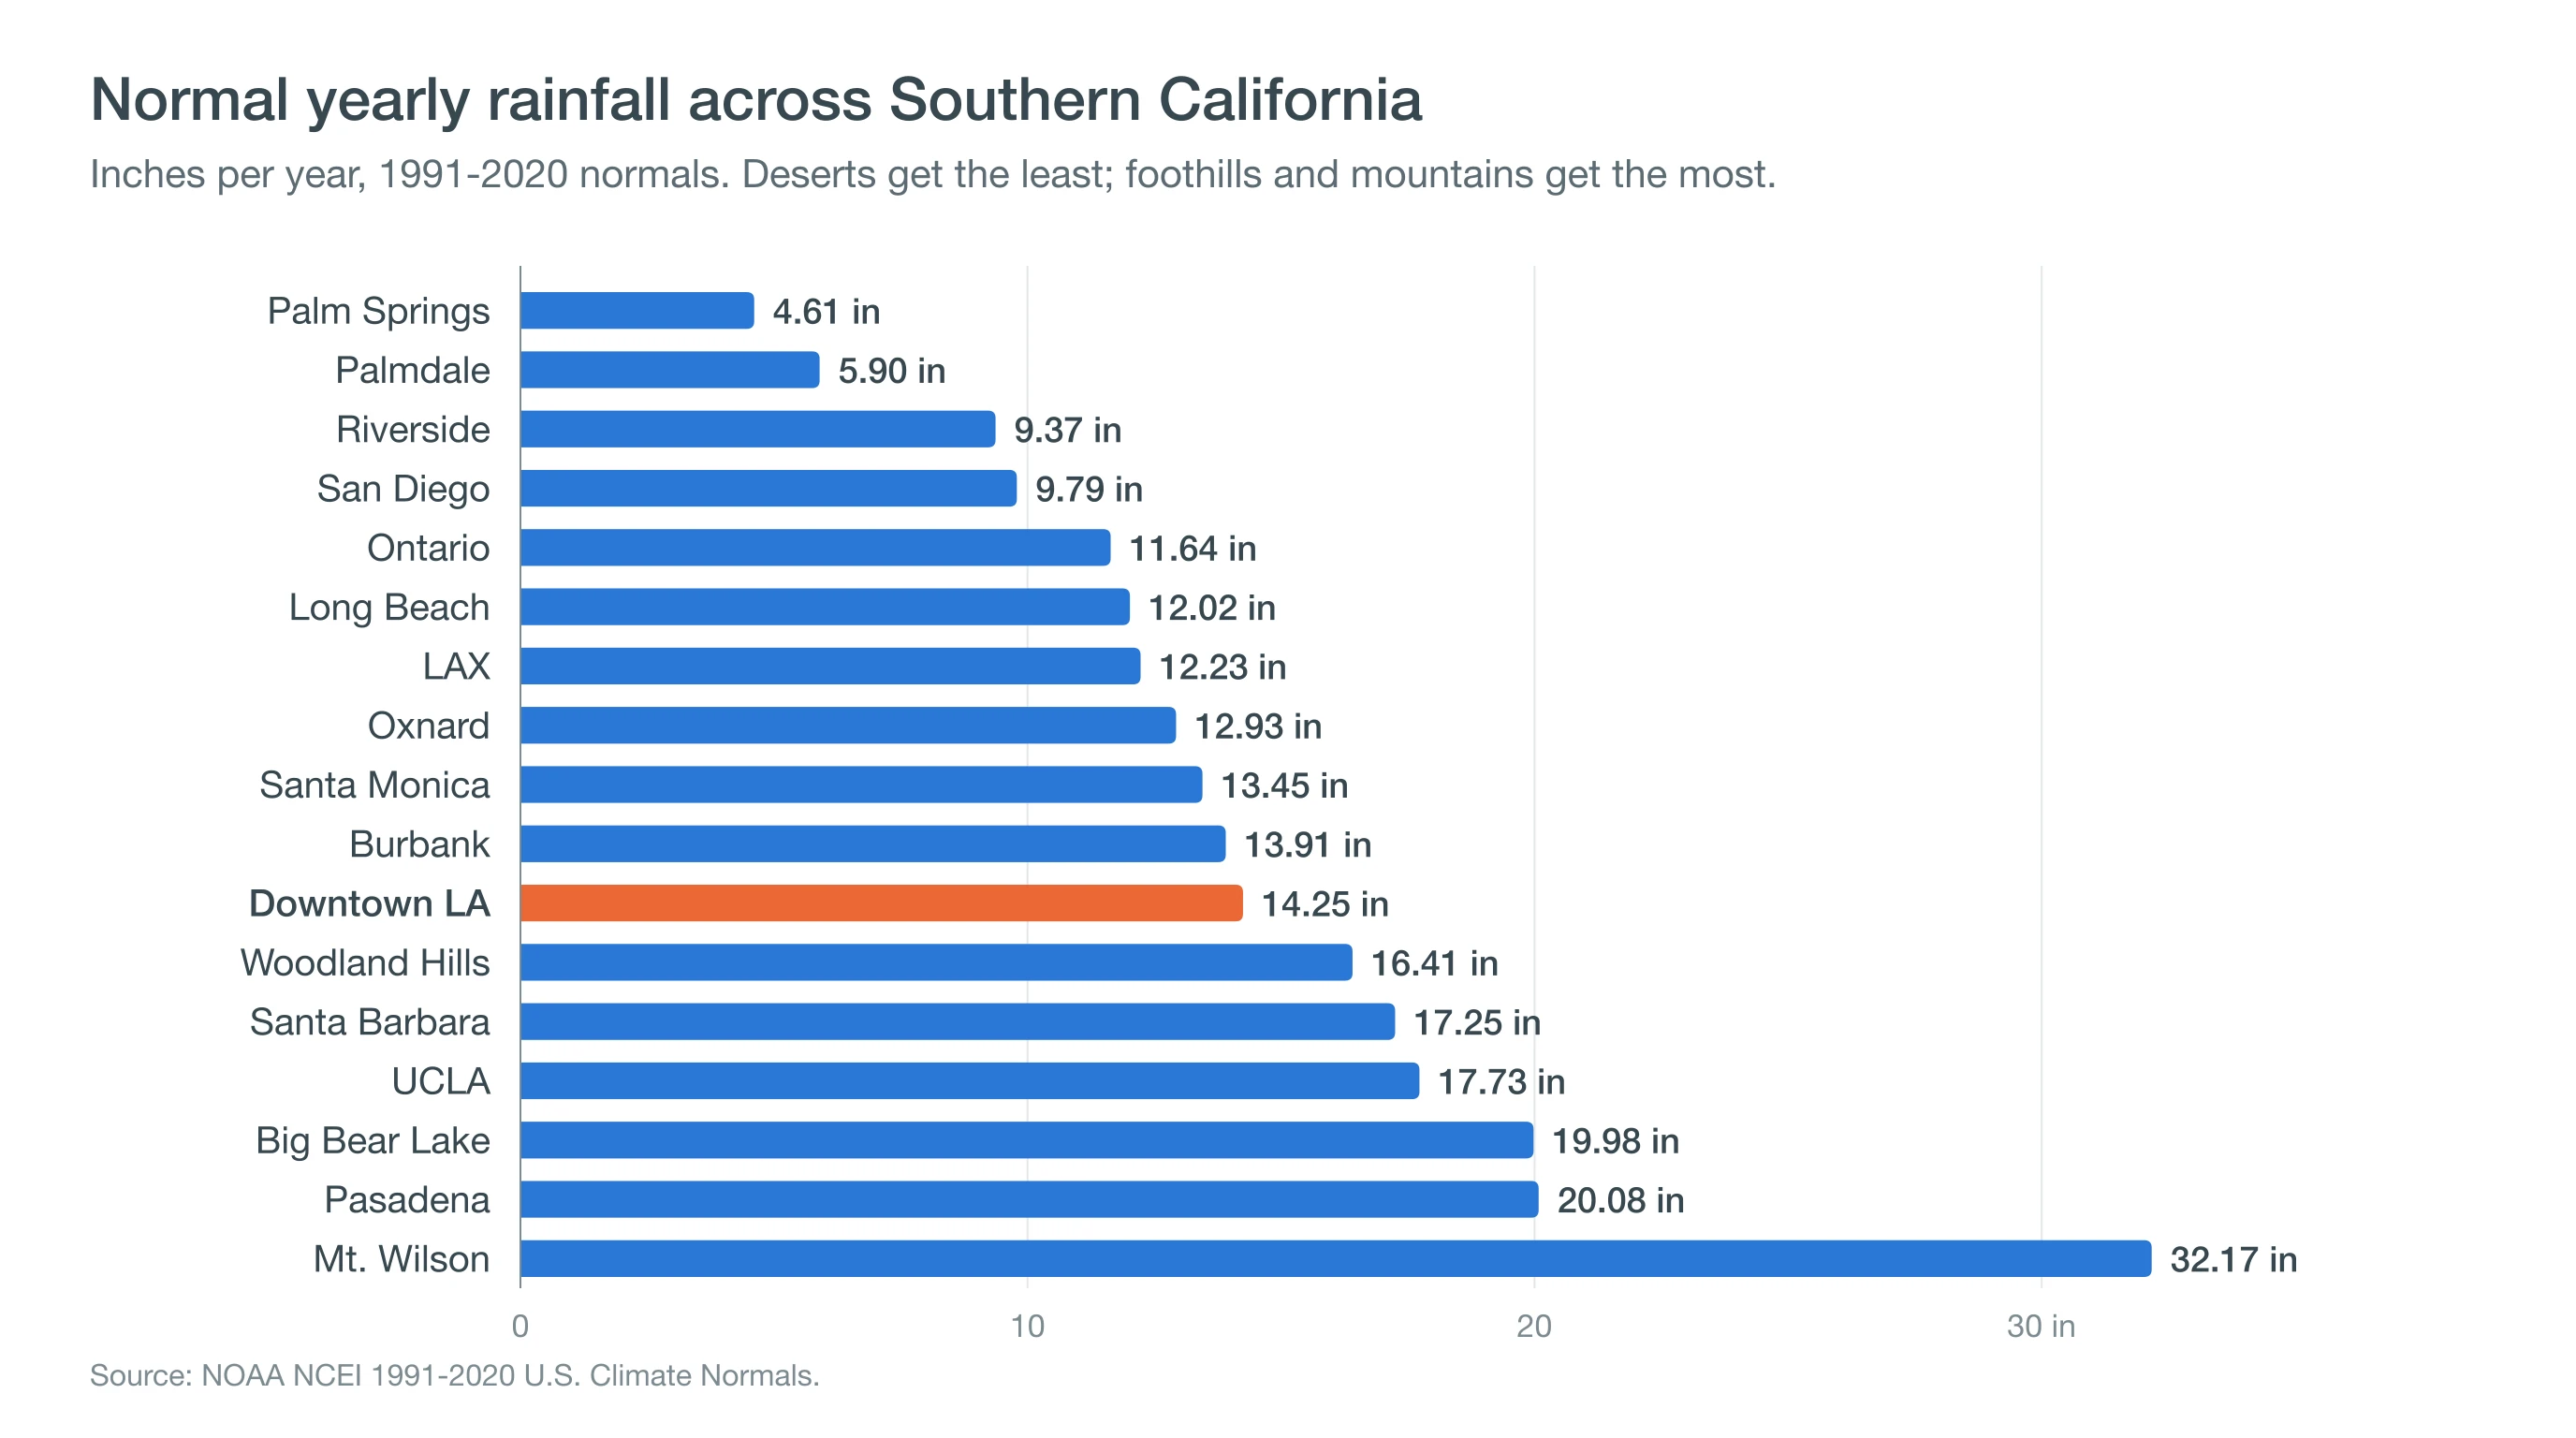
The same order holds in a wet year. In 2022-23, Pasadena got 47.88 inches and San Diego 15.76. The differences between cities come from geography, so they repeat year after year.
How Did the 2025-26 Rain Season Compare Across the Region?
The 2025-26 rain season was wet almost everywhere in Los Angeles County and near normal farther south and inland. Downtown finished at 19.73 inches, 138% of normal, after a dry 2024-25 when it got just 8.26. Burbank and Van Nuys topped 150% of normal, while San Diego finished almost exactly at its average and Riverside and Palm Springs finished below. Moisture from Hurricane Marie on September 6, 2026 added late rain in the LA area, including 0.71 inch Downtown and 1.41 inches at Burbank.
| Station | Normal | 2024-25 | 2025-26 | 2025-26 vs. normal |
|---|---|---|---|---|
| Palm Springs | 4.61 | 2.87 | 3.67 | 80% |
| Palmdale | 5.90 | 2.87 | 8.01 | 136% |
| Riverside | 9.37 | 4.39 | 8.25 | 88% |
| San Diego | 9.79 | 5.07 | 10.11 | 103% |
| Ontario | 11.64 | 6.34 | 12.64 | 109% |
| Fullerton | 11.86 | 4.53 | 16.55 | 140% |
| Long Beach | 12.02 | 5.06 | 13.96 | 116% |
| LAX | 12.23 | 5.15 | 14.18 | 116% |
| Santa Monica | 13.45 | 7.18 | 17.97 | 134% |
| Van Nuys | 13.42 | 6.17 | 20.96 | 156% |
| Burbank | 13.91 | 6.57 | 21.02 | 151% |
| Downtown LA | 14.25 | 8.26 | 19.73 | 138% |
| Woodland Hills | 16.41 | 7.14 | 24.45 | 149% |
| Santa Barbara | 17.25 | 7.33 | 23.48 | 136% |
| UCLA | 17.73 | 9.13 | 21.32 | 120% |
| Pasadena* | 20.08 | 9.35 | 23.80 | 119% |
| Mt. Wilson | 32.17 | 23.52 | 58.52 | 182% |
2025-26 is provisional through September 28, 2026 (RCC ACIS daily data). *Pasadena's volunteer gauge recorded no rain in the September 6 storm, so its total is likely a little low.
For Downtown's full record back to 1877, including the wettest and driest seasons ever, see Los Angeles rainfall totals by year.
Why Can One Storm Drop 2 Inches in San Diego and 12 at UCLA?
One storm can drop 2 inches in San Diego and 12 at UCLA because of where the storm aims and what the air hits when it gets there. Most big Southern California storms are atmospheric rivers, long bands of moisture that arrive from the west or southwest and often point at Central California or the LA area rather than San Diego. When that moist air runs into the Santa Monica and San Gabriel mountains, it is forced upward, cools and drops extra rain on the slopes that face the storm.
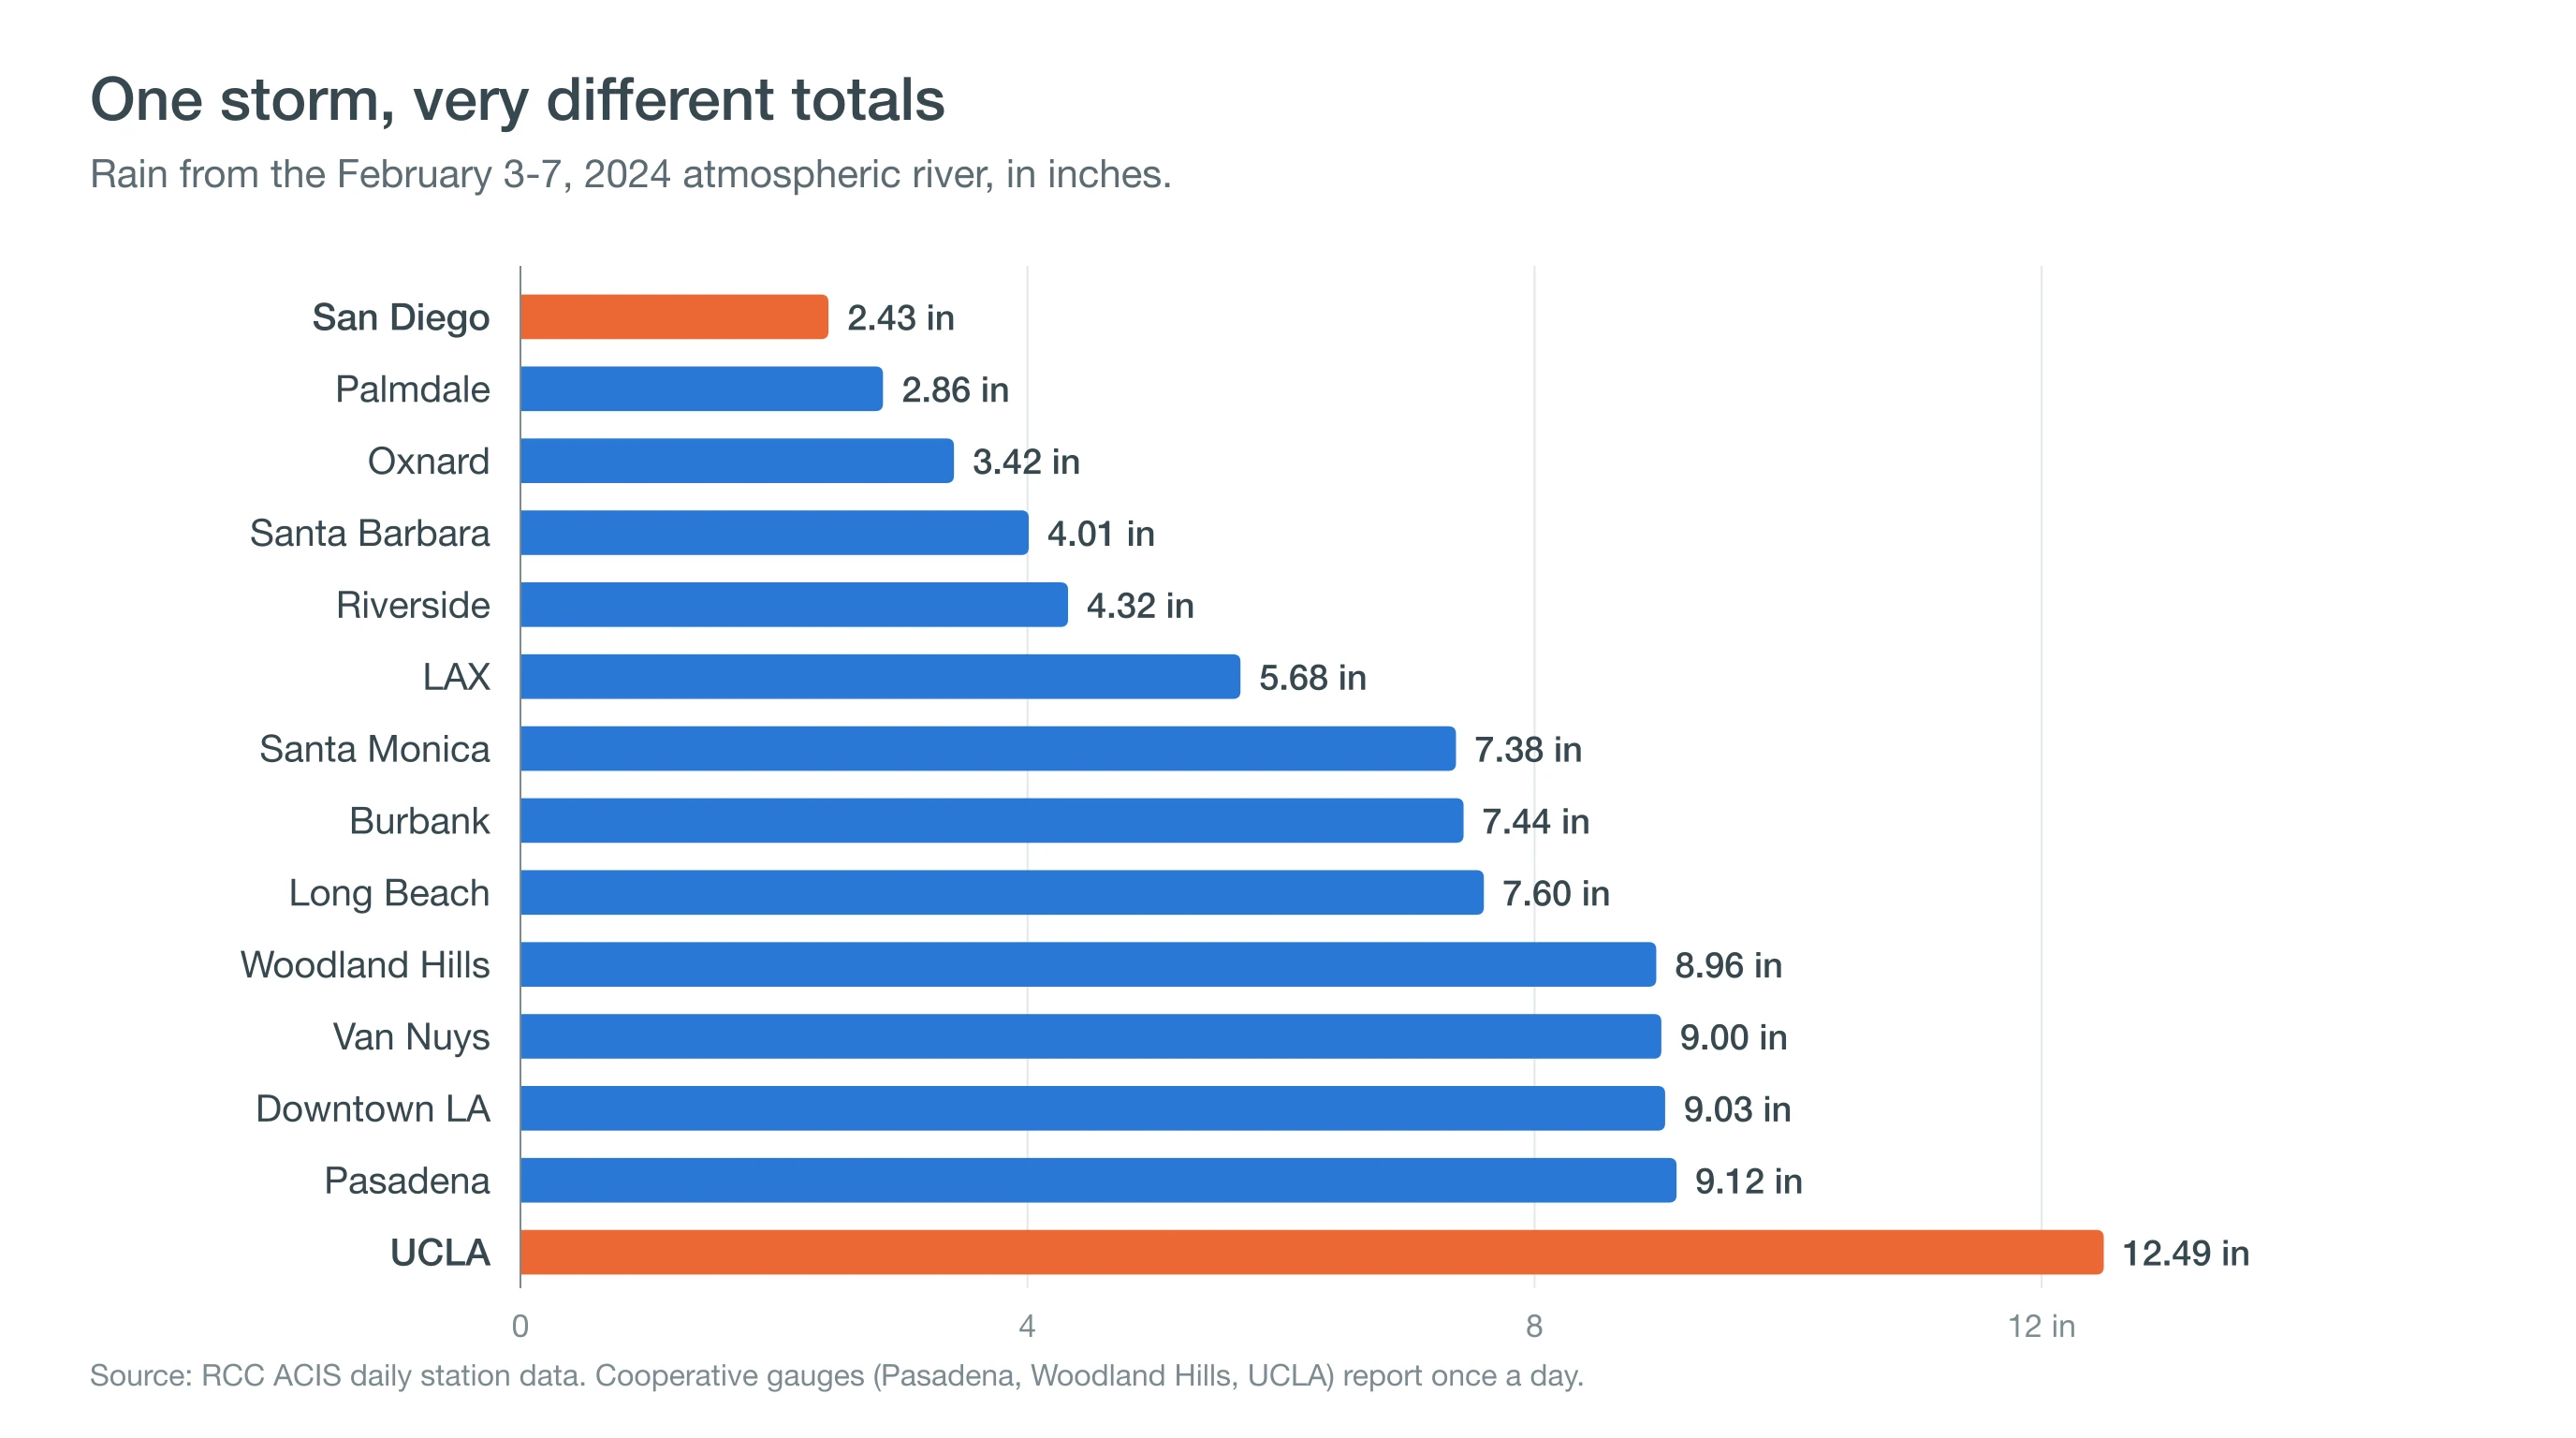
UCLA sits at the base of the Santa Monica Mountains, which is why it got more rain than any other station in February 2024. The National Weather Service reported four-day totals near 13 inches in Bel Air and 13.86 inches near Cogswell Dam in the San Gabriels. Downtown got 9.03 inches, including a record 2.93 inches on February 5.
The flat coastal plain from LAX to Long Beach got less, and Santa Barbara and Oxnard, farther west, got only 3 to 4 inches, well away from the heaviest rain. The mountains explainer explains how mountains lift storm air.
Why Do the Mountains and Deserts Get Such Different Totals?
Southern California's mountains and deserts get such different totals because they sit on opposite sides of the same ranges. Storm air rises up the ocean-facing slopes and drops its moisture there, so Mt. Wilson, at about 5,700 feet above Pasadena, averages 32.17 inches a year, and it caught 58.52 inches in 2025-26.
By the time that air sinks down the far side, it has warmed and dried out. That rain shadow is why Palmdale, just over the San Gabriels, averages 5.90 inches, and Palm Springs, behind the San Jacinto Mountains, averages 4.61.
Big Bear Lake falls in between. At about 6,750 feet in the San Bernardino Mountains, it averages 19.98 inches of precipitation, much of it as snow, less than Mt. Wilson because it sits farther from the first ridge that storms hit.
Which Rain Gauge Should You Trust for Your Neighborhood?
The rain gauge to trust for your neighborhood is the one closest to you, as long as you compare the same time window. The cities in this article are National Weather Service climate stations, mostly at airports, with long, quality-controlled records. That makes them the right choice for normals and records, but they can be miles from your street. Los Angeles County Public Works runs a much denser network of rain gauges with near-real-time data, and volunteer networks such as CoCoRaHS add backyard gauges between them.
Before comparing two numbers, check the time window each one covers. Airport stations total rain from midnight to midnight. Volunteer and cooperative gauges, including Pasadena, Woodland Hills and UCLA, are read once a day, usually in the morning, so a storm total can shift by a day. And a "season total" might mean the October-to-September water year, the July-to-June rain year some agencies use, or the calendar year.
Where Can You Check Rainfall Totals During a Storm?
During a storm, the National Weather Service offices in Los Angeles/Oxnard and San Diego post rainfall-total reports that list dozens of gauges, updated as the storm goes on. For your own street, the LA County Public Works map has gauges closer to you. For decisions about flooding, follow National Weather Service watches and warnings rather than a single gauge reading: a burst of an inch an hour can flood a street even when the storm total is modest. Local flood risks are covered in the guides to flash flooding in Pasadena and flash flooding in Orange County.
Southern California's rain pattern stays the same even when seasons vary: more rain to the north and west, more uphill, and far less behind the mountains. Find your city in the tables, then check the forecast rain totals on our Downtown Los Angeles, Pasadena and Long Beach pages before the next storm. How a normal winter unfolds is in what a wet LA winter looks like.