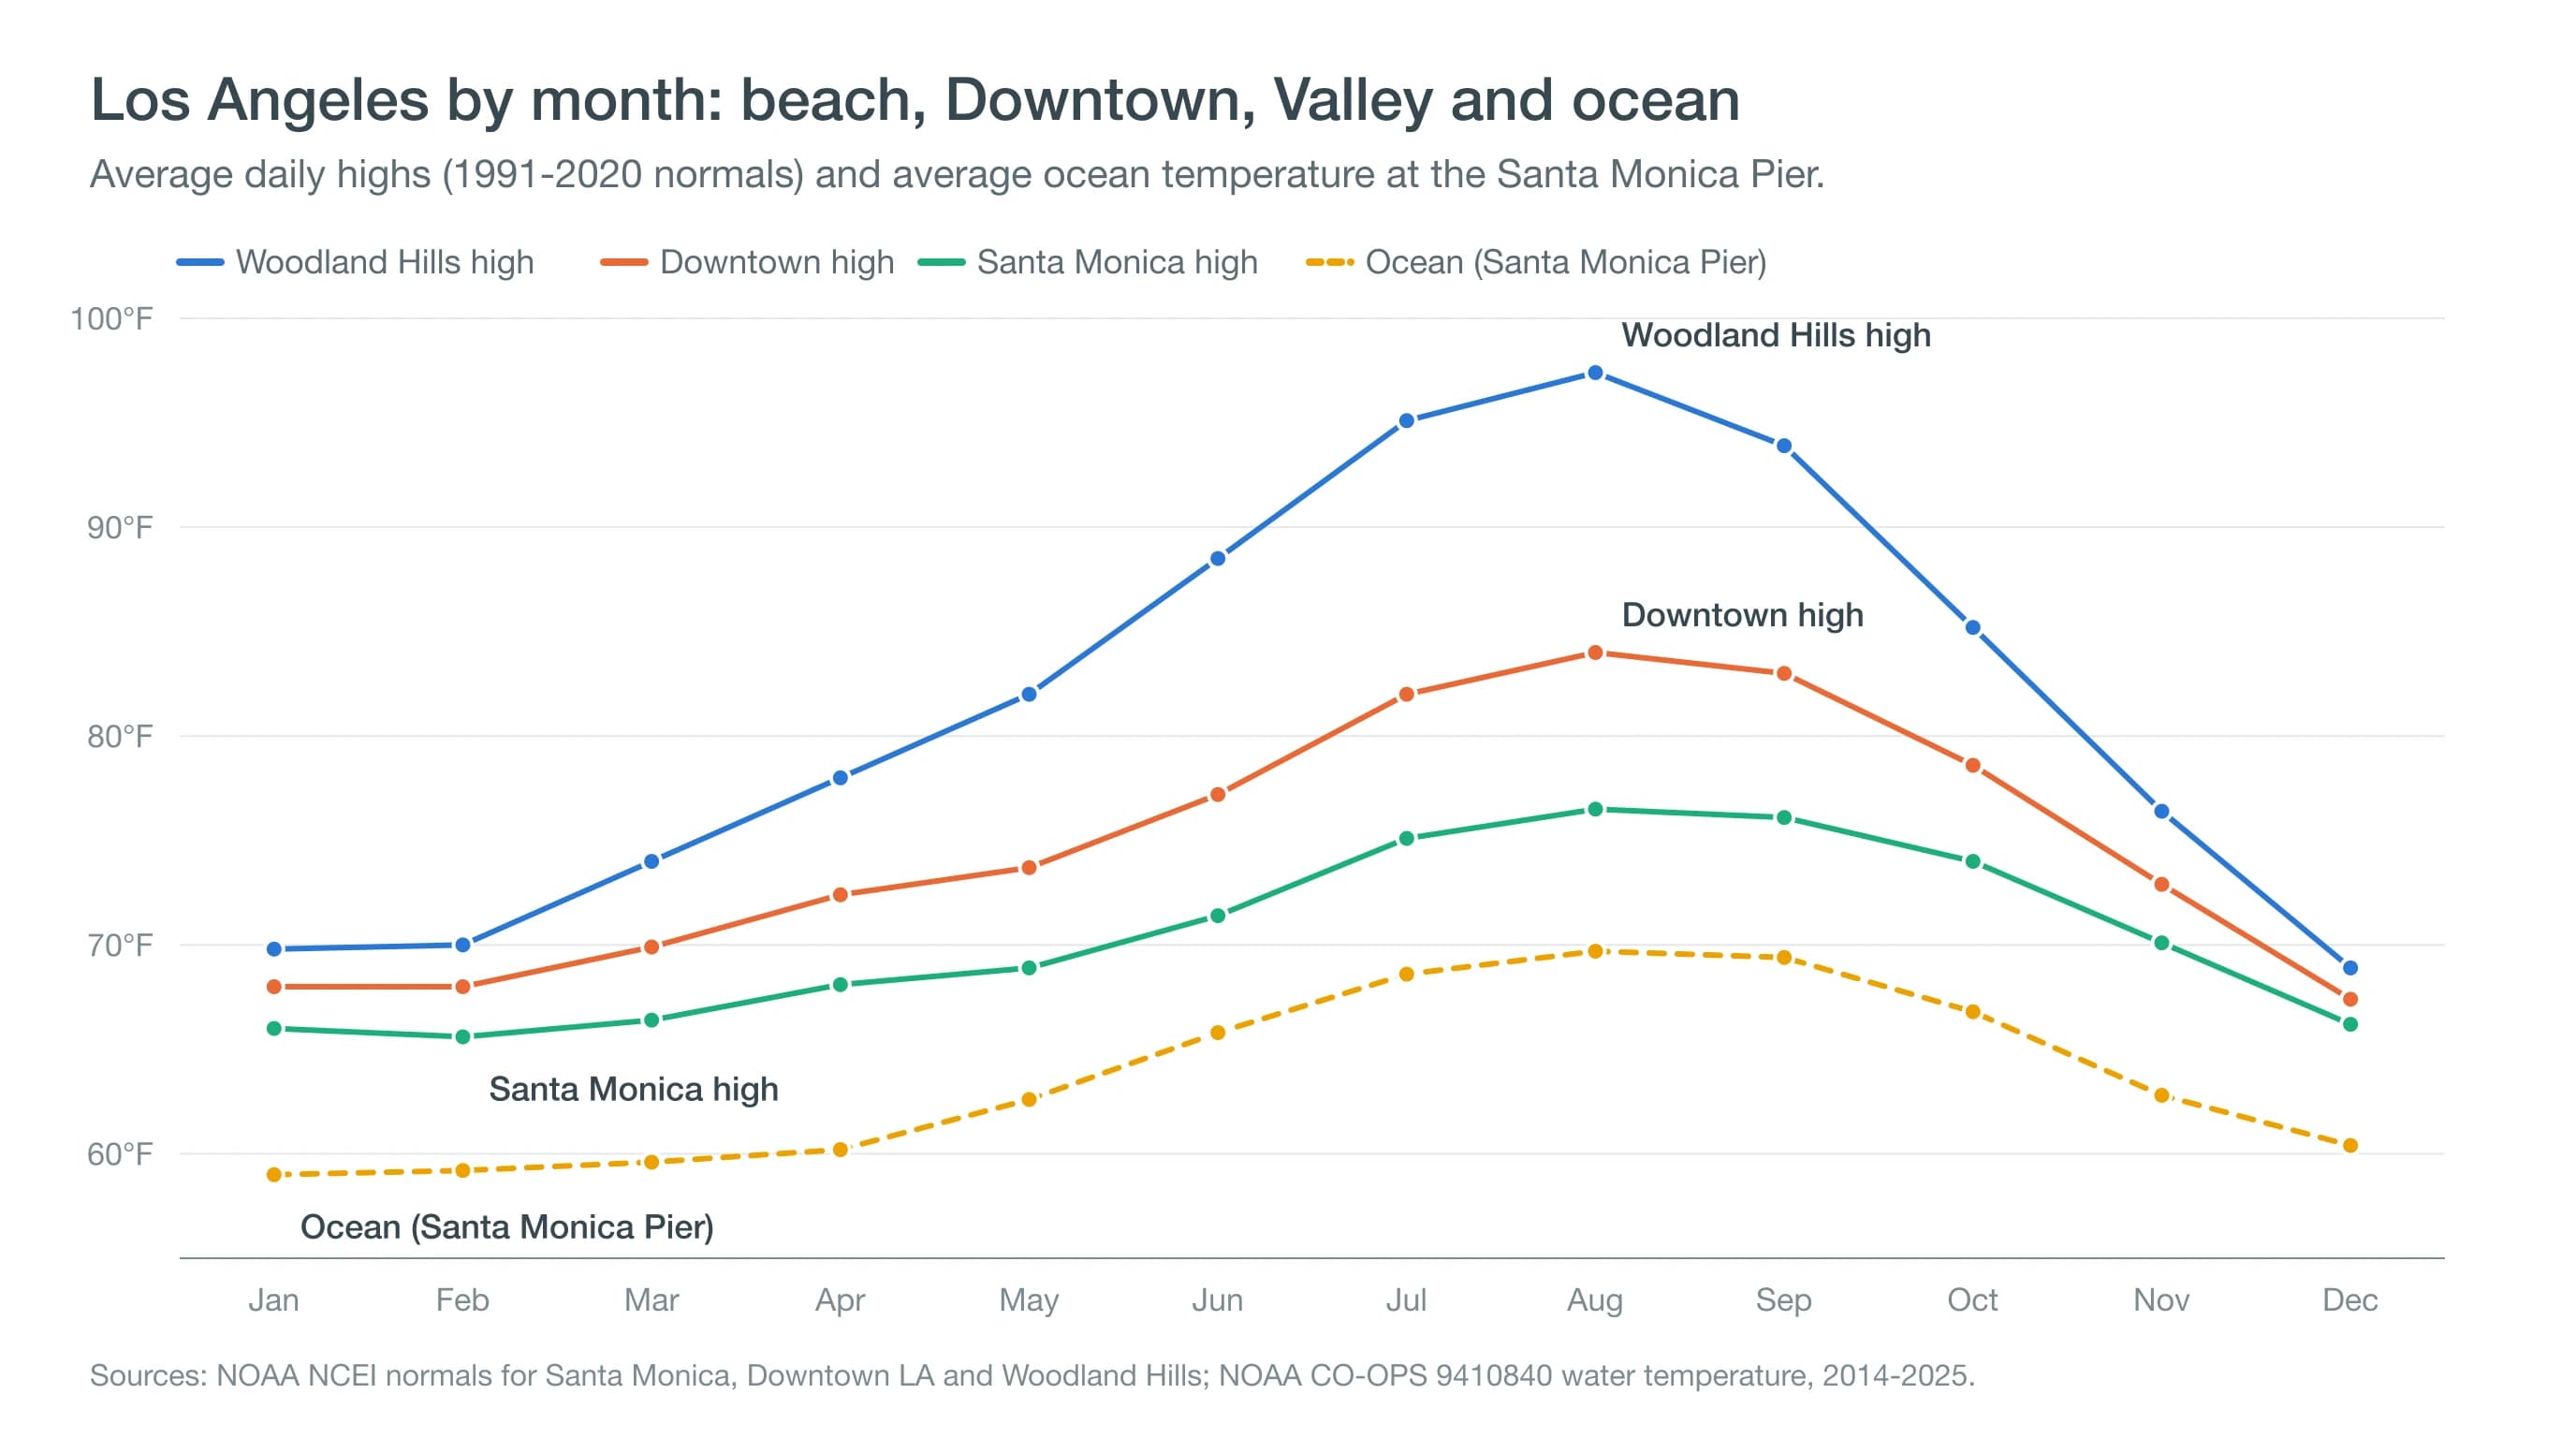
Los Angeles is mild all year, and its warmest weather comes later than most visitors expect. Downtown highs range from about 67°F in December to 84°F in August, lows from 48°F to 65°F, and nearly all of the 14.25 inches of yearly rain falls between November and April, with February the wettest month. The beach is cooler than Downtown, and the San Fernando Valley is much hotter, especially from June to October.
Downtown Los Angeles averages 78.6°F in October and 77.2°F in June. The Pacific off Santa Monica is warmer in September than in July. If you plan an LA trip by the calendar alone, you may pack for the wrong season (see what to pack for LA by month). This guide lays out all twelve months with beach, Downtown and Valley numbers side by side, then explains three things that surprise visitors: gray early summers, hot autumns and a rainy season that arrives in a few big storms.
What Is the Weather Like in Los Angeles Each Month?
Los Angeles weather is mild in every month, warmest in August and September and wettest in February. The table below uses NOAA's 1991-2020 normals for three stations that cover the city's range: the Santa Monica airport for the beach, Downtown for the center and Woodland Hills for the west San Fernando Valley. Ocean temperatures come from the Santa Monica Pier gauge, detailed in LA ocean water temperature by month.
| Month | Downtown high / low | Rain | Beach high | Valley high | Ocean |
|---|---|---|---|---|---|
| January | 68 / 49 | 3.29 in | 66 | 70 | 59 |
| February | 68 / 50 | 3.64 in | 66 | 70 | 59 |
| March | 70 / 52 | 2.23 in | 66 | 74 | 60 |
| April | 72 / 55 | 0.69 in | 68 | 78 | 60 |
| May | 74 / 58 | 0.32 in | 69 | 82 | 63 |
| June | 77 / 61 | 0.09 in | 71 | 89 | 66 |
| July | 82 / 65 | 0.02 in | 75 | 95 | 69 |
| August | 84 / 65 | 0.00 in | 77 | 97 | 70 |
| September | 83 / 64 | 0.13 in | 76 | 94 | 69 |
| October | 79 / 60 | 0.58 in | 74 | 85 | 67 |
| November | 73 / 53 | 0.78 in | 70 | 76 | 63 |
| December | 67 / 48 | 2.48 in | 66 | 69 | 60 |
Two numbers explain most of the table. Between the coast and the west Valley, average summer highs differ by about 20 degrees, a gap laid out neighborhood by neighborhood in Los Angeles weather by neighborhood. The ocean, which sets the coast's temperature, warms and cools about two months after the sun does.
Why Is October Warmer Than June in Los Angeles?
October is warmer than June in Los Angeles because cool ocean clouds cover the coast in June, while hot, dry desert air reaches it in October. In late spring, cool ocean air and low clouds hold the coast near 71°F, a pattern locals call June Gloom. By late summer the marine layer thins, the ocean reaches its warmest (about 70°F off Santa Monica in August and September), and coastal nights stay mild.
In fall, offshore winds add more heat. When air flows from the deserts toward the coast, it shuts off the sea breeze and lets heat reach the beaches. Downtown's October record is 108°F, and 31 of the last 35 Octobers brought at least one 90°F day there. Details for October are in Los Angeles weather in October.
When Is the Rainy Season in Los Angeles?
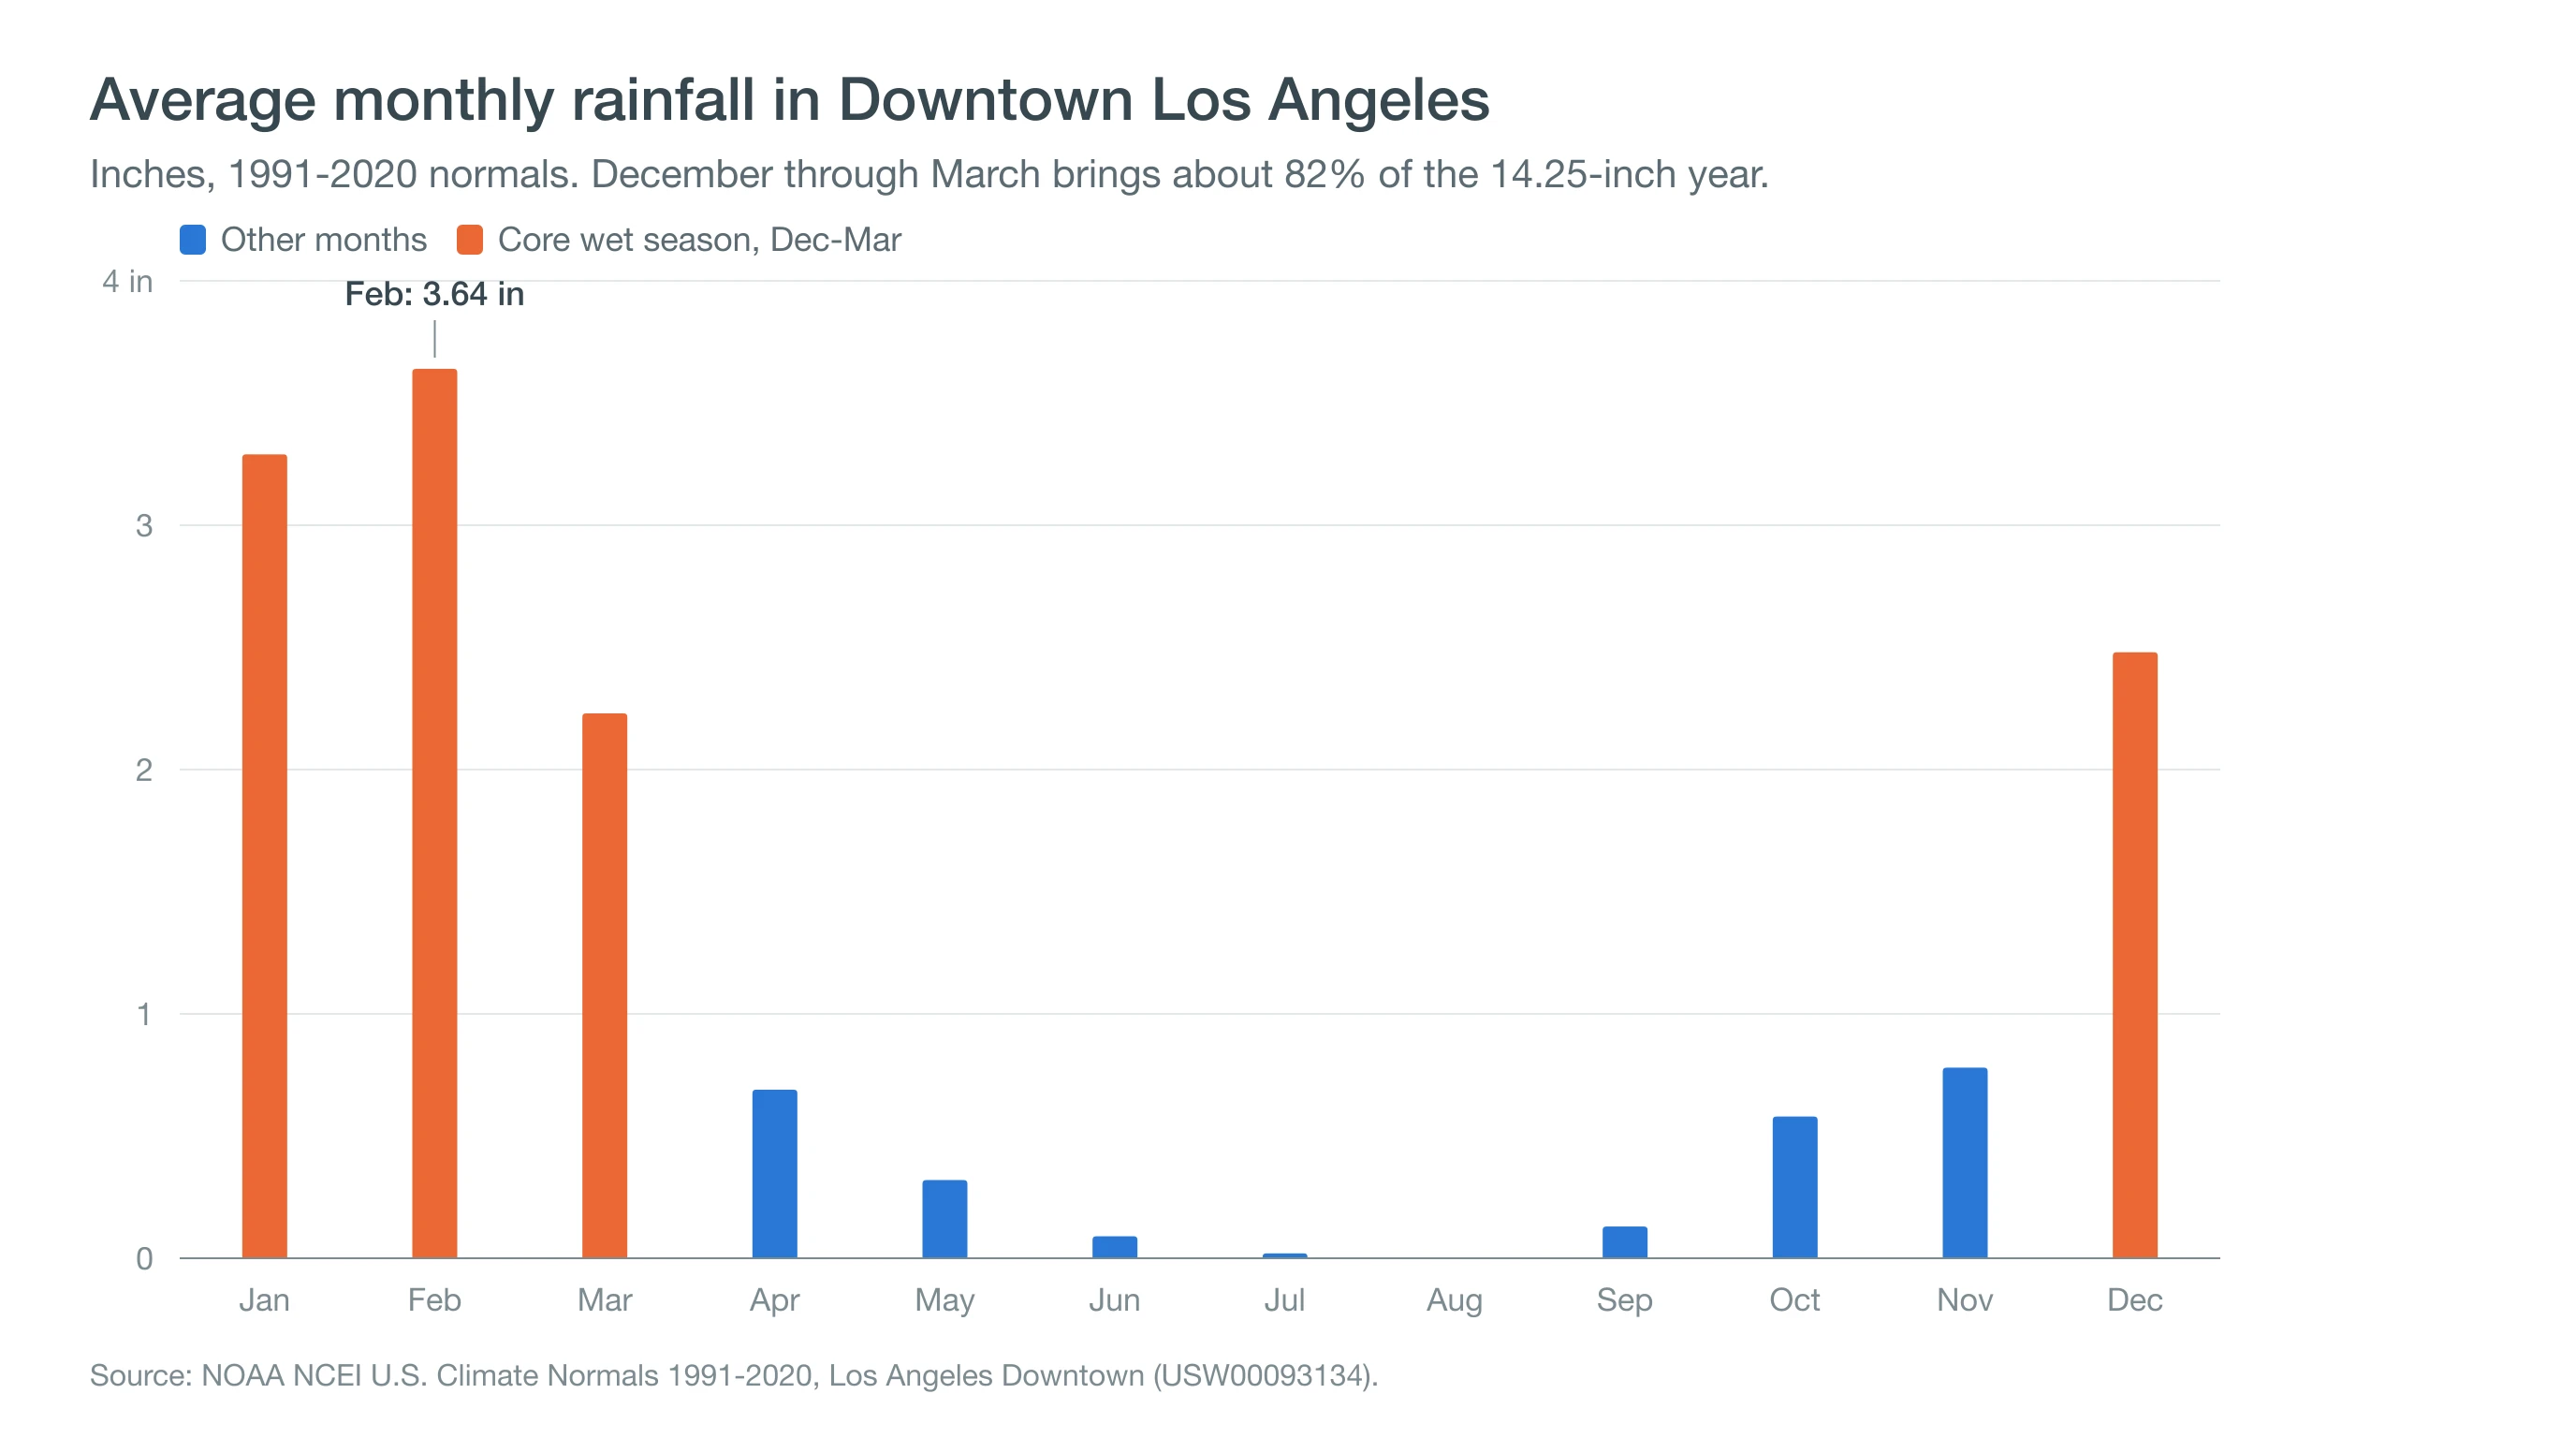
The rainy season in Los Angeles runs from November through April, with the core from December to March. Those four months bring about 82% of Downtown's 14.25 inches, on roughly 23 rainy days. February is the wettest month at 3.64 inches, followed by January at 3.29.
June through September averages less than a quarter inch combined. Most days are dry even in the wet season: New Year's Day sees rain only about one year in nine, as the Rose Parade rain history shows. Los Angeles has a Mediterranean climate: wet winters and long, dry summers. For when the heat peaks and why, see the hottest months in Los Angeles.
Rain comes in a handful of storms, often a few days of heavy rain followed by a week or more of sunshine. That pattern is why a wet LA winter comes down to a few big storms. Winter highs stay in the upper 60s, and nights drop into the upper 40s Downtown and the low 40s in the Valley. How this season compares with normal is tracked in Los Angeles rainfall totals.
What Are May Gray and June Gloom, and When Do They Clear?
May Gray and June Gloom are the late-spring season when a deep marine layer covers the Los Angeles coast most mornings. At the Santa Monica airport, a low cloud ceiling is reported at 9 a.m. on about 55% of May days and 59% of June days, compared with about 15% in January.
Most mornings clear by early afternoon, and only about one June afternoon in seven stays gray. Inland, the clouds burn off earlier or never arrive, which is why June averages about 89°F in Woodland Hills but only 71°F in Santa Monica. The marine layer explainer covers why.
How Hot Does Los Angeles Get in Summer and Early Fall?
Los Angeles gets hot in summer and early fall: Downtown averages 84°F in August and about 25 days a year at 90°F or hotter, mostly from July to October. The Valley is far hotter: Woodland Hills averages 97.4°F in August and 90°F or more on about 115 days a year. The biggest heat waves usually come late in the season. Downtown's all-time record, 113°F, was set on September 27, 2010, and September 2026 brought 105°F Downtown on the 9th.
Summer evenings are long and pleasant. Sunset comes at 8 p.m. or later from about June 1 to July 25, and coastal evenings cool into the 60s. A Dodgers night game in August starts near 75°F and ends near 70°F. In winter, sunset comes as early as about 4:44 p.m. in early December, and a December night game at SoFi Stadium ends near 58°F.
Which Months Suit Beaches, Hiking and Sightseeing?
The best months for LA activities depend on the plan. For the beach, late July to early October brings the sunniest afternoons and the warmest water, about 69-70°F at the Santa Monica Pier. For hiking, November to May avoids the summer heat that makes Valley and canyon trails dangerous at midday; spring adds green hills after winter rain.
For sightseeing, May, June, October and November combine mild Downtown days with lower heat risk, though June mornings at the coast are often gray. Winter works well too if you plan indoor backups for the few stormy days. For an island day trip, September and October bring the calmest crossings; see Catalina Island weather by month.
Plan a Los Angeles trip around both the month and the part of the city you will visit. Use the table to choose your month, then check the forecast for Santa Monica, Downtown and Woodland Hills on our destination pages a week before you go to see how this year is tracking compared with normal. Climate data comes from the NOAA 1991-2020 U.S. Climate Normals and ocean data from NOAA station 9410840.