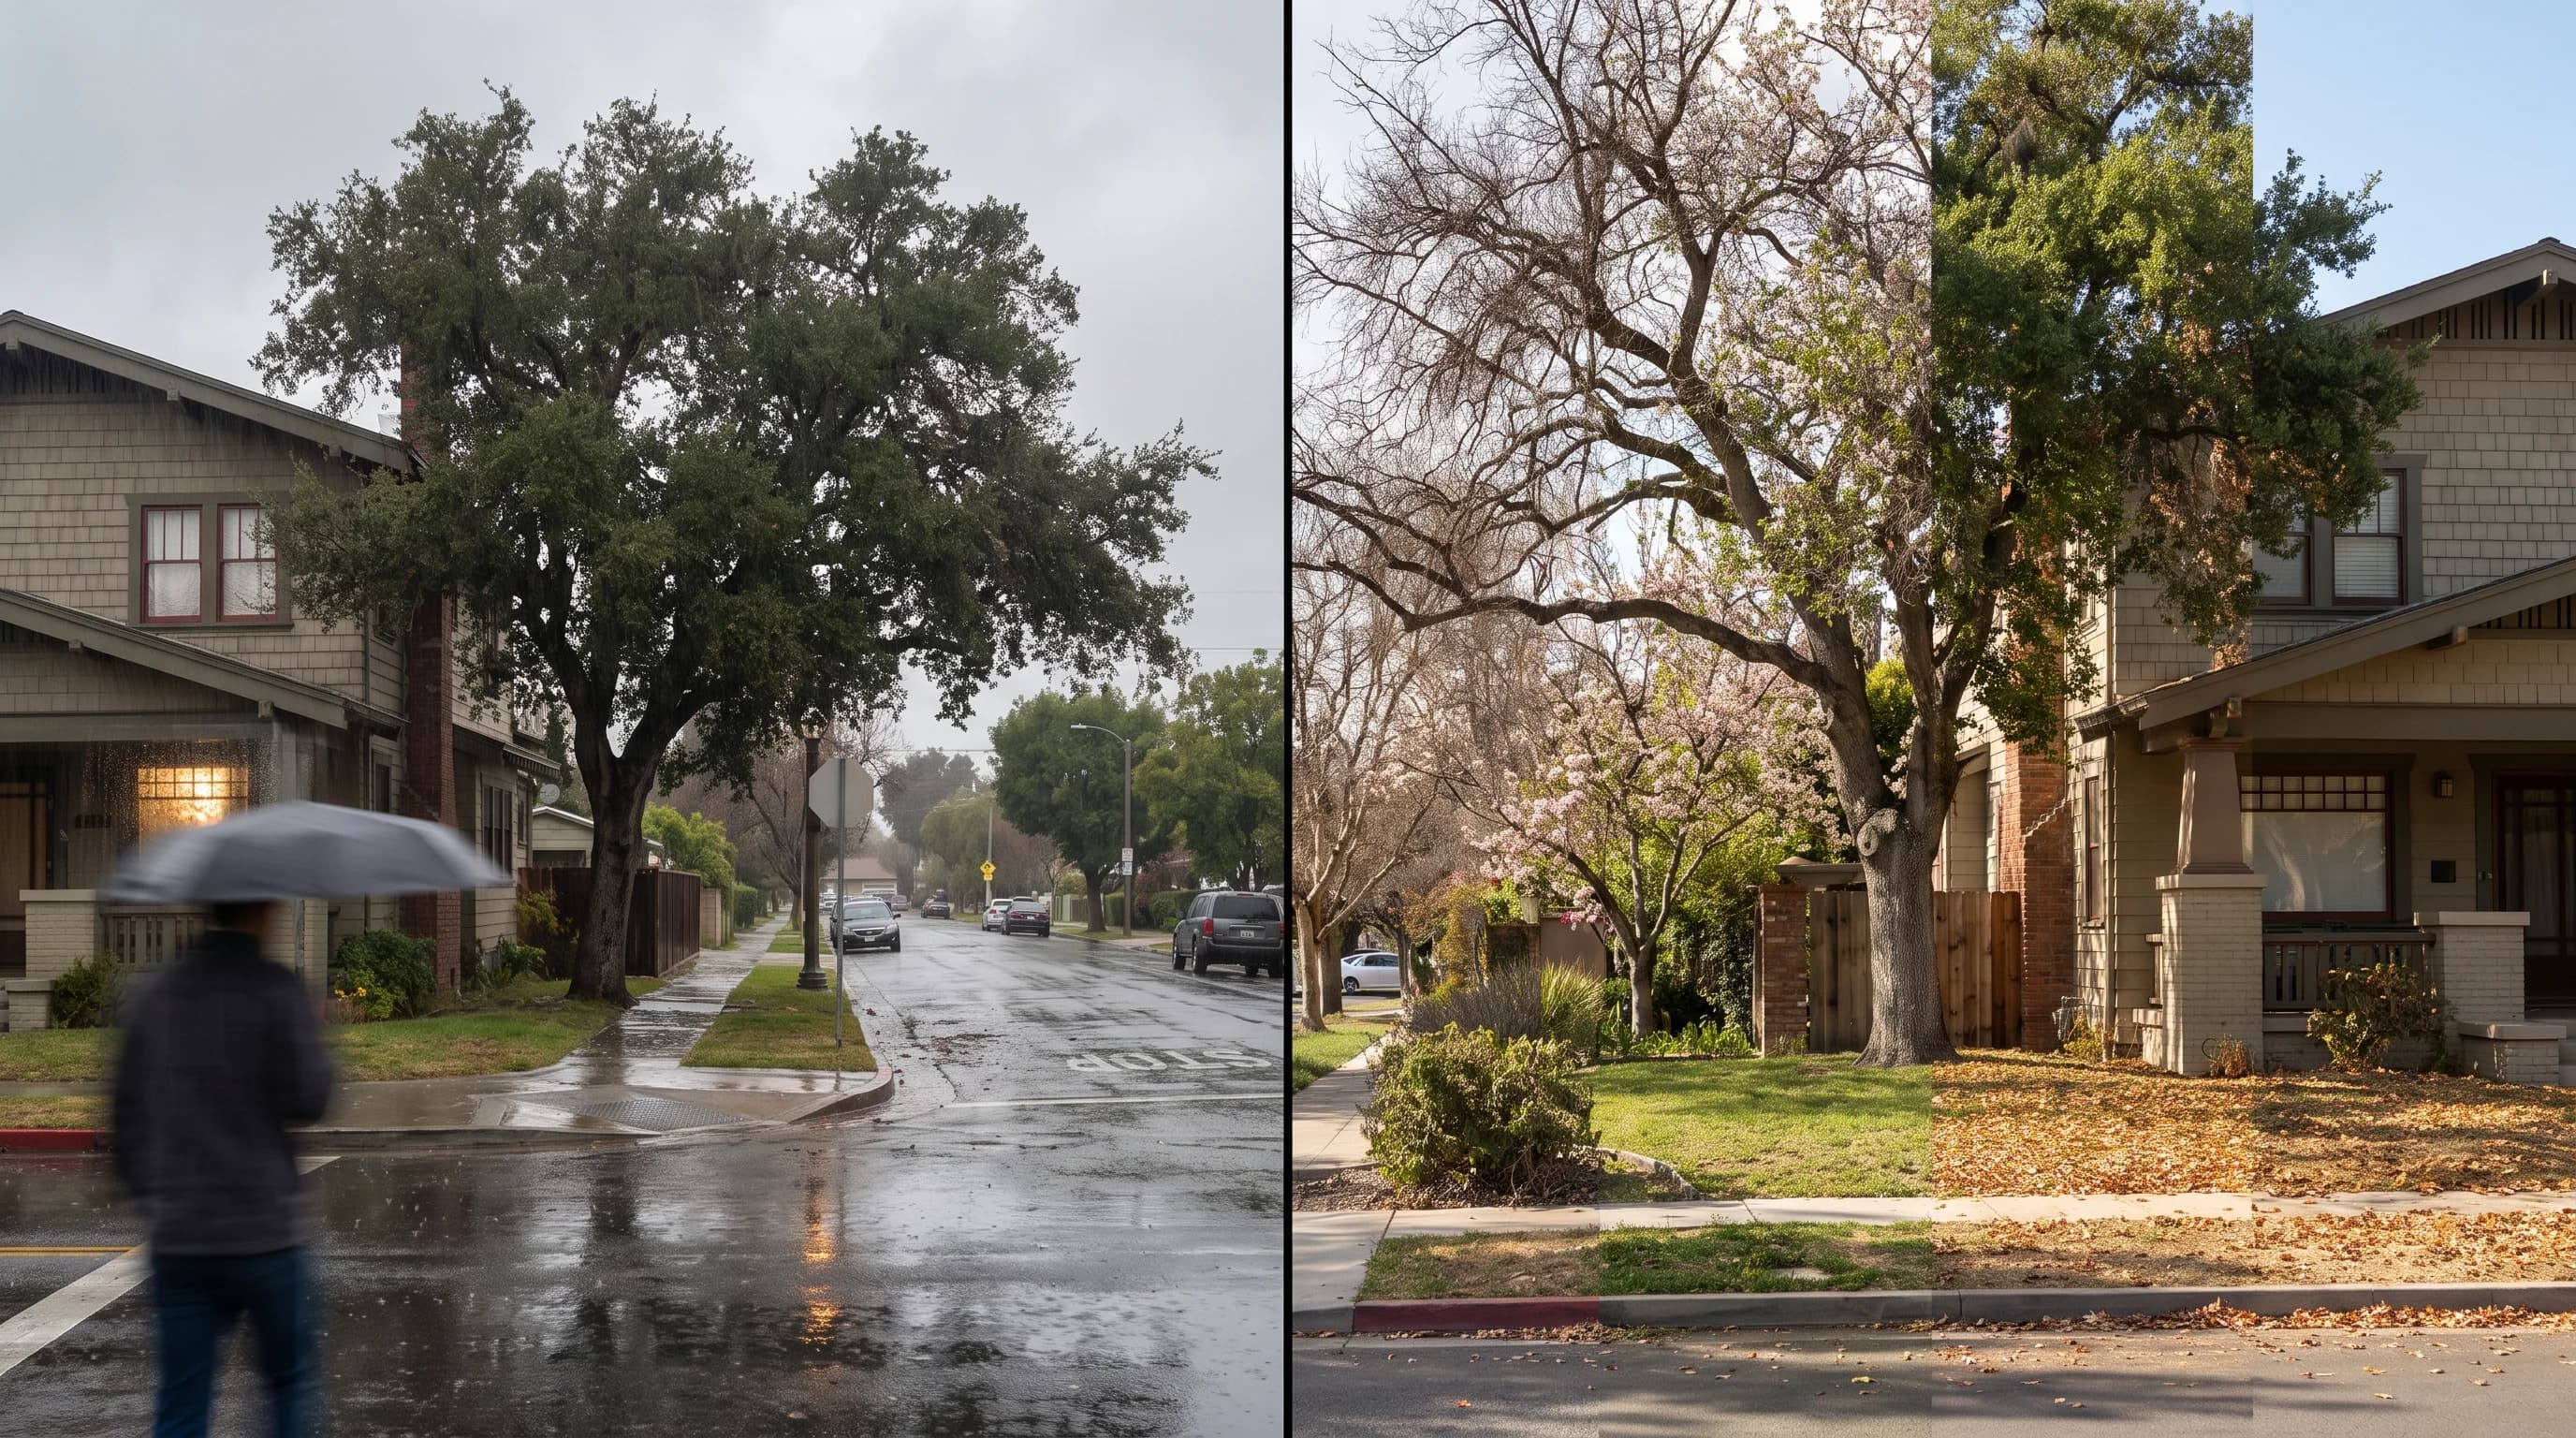
Weather is the state of the atmosphere at a specific place and time: the temperature, wind, clouds and rain chance today or over the next several days. Climate is the long-term pattern behind that weather, built from decades of data, including the average, the normal range and the extremes.
Southern California shows both clearly. The same region that produces surprising forecasts has one of the best-documented climate records in the western United States. Some of its biggest events predate instruments, like the Great Flood of 1862, known from newspapers and sediment cores instead of gauges.
What Is the Difference Between Weather and Climate?
Weather is short-term and specific; climate is long-term and statistical. Weather answers what the atmosphere is doing here now and in the next hours or days. Climate answers what the atmosphere usually does in a place over many years, including how much it varies. NOAA Climate.gov defines weather as conditions over minutes to weeks, and climate as average weather, plus its variability and extremes, over years to decades.
Climate includes variability and extremes, not just averages. Climate is more than the normal July high; it also includes how often and how far July misses that normal. Los Angeles has a Mediterranean climate, with wet winters and dry summers.
A single 100°F day in Los Angeles is weather. The fact that inland valleys hit 100°F most summers while the coast almost never does is climate. The two statements do not conflict; they answer questions on different timescales. Earthquakes are geology, not weather or climate; see is earthquake weather real.
| Question | Weather answer | Climate answer |
|---|---|---|
| Will it rain Saturday? | NWS point forecast for a specific storm system | Los Angeles averages roughly 14-15 inches of rain per year, mostly November through April |
| How hot will it be in Woodland Hills next Tuesday? | A 7-day forecast high from a specific NWS model run | A 1991-2020 normal high for that calendar date at the nearest long-term station |
| Is this winter unusually wet? | Season-to-date rainfall compared with the same dates last year | Season-to-date rainfall compared with the 30-year normal and the full historical range |
| Is Los Angeles getting hotter? | Not answerable from any single day or season | A multi-decade trend line built from consistent station records and state climate assessments |
How Long Is a Climate Normal?
A climate normal spans 30 years. NOAA's National Centers for Environmental Information recalculates the official U.S. Climate Normals every decade, and the current reference period is 1991-2020.
Thirty years is long enough to smooth out any one unusual year and recent enough to reflect today's climate. When the window updates, the normal high or low for a date can shift slightly, so a normal means little without its baseline years.
Climatologists use other windows for other questions. A 10- or 15-year average can reveal a recent shift before the next official update, and century-long station records reveal long-term trends. None of these replaces the 30-year normal as the standard reference. Any normal or "typical" value cited for Southern California should name its years, because the normal August high for 1981-2010 and for 1991-2020 can differ.
How Do LA Microclimates Fit the Distinction?
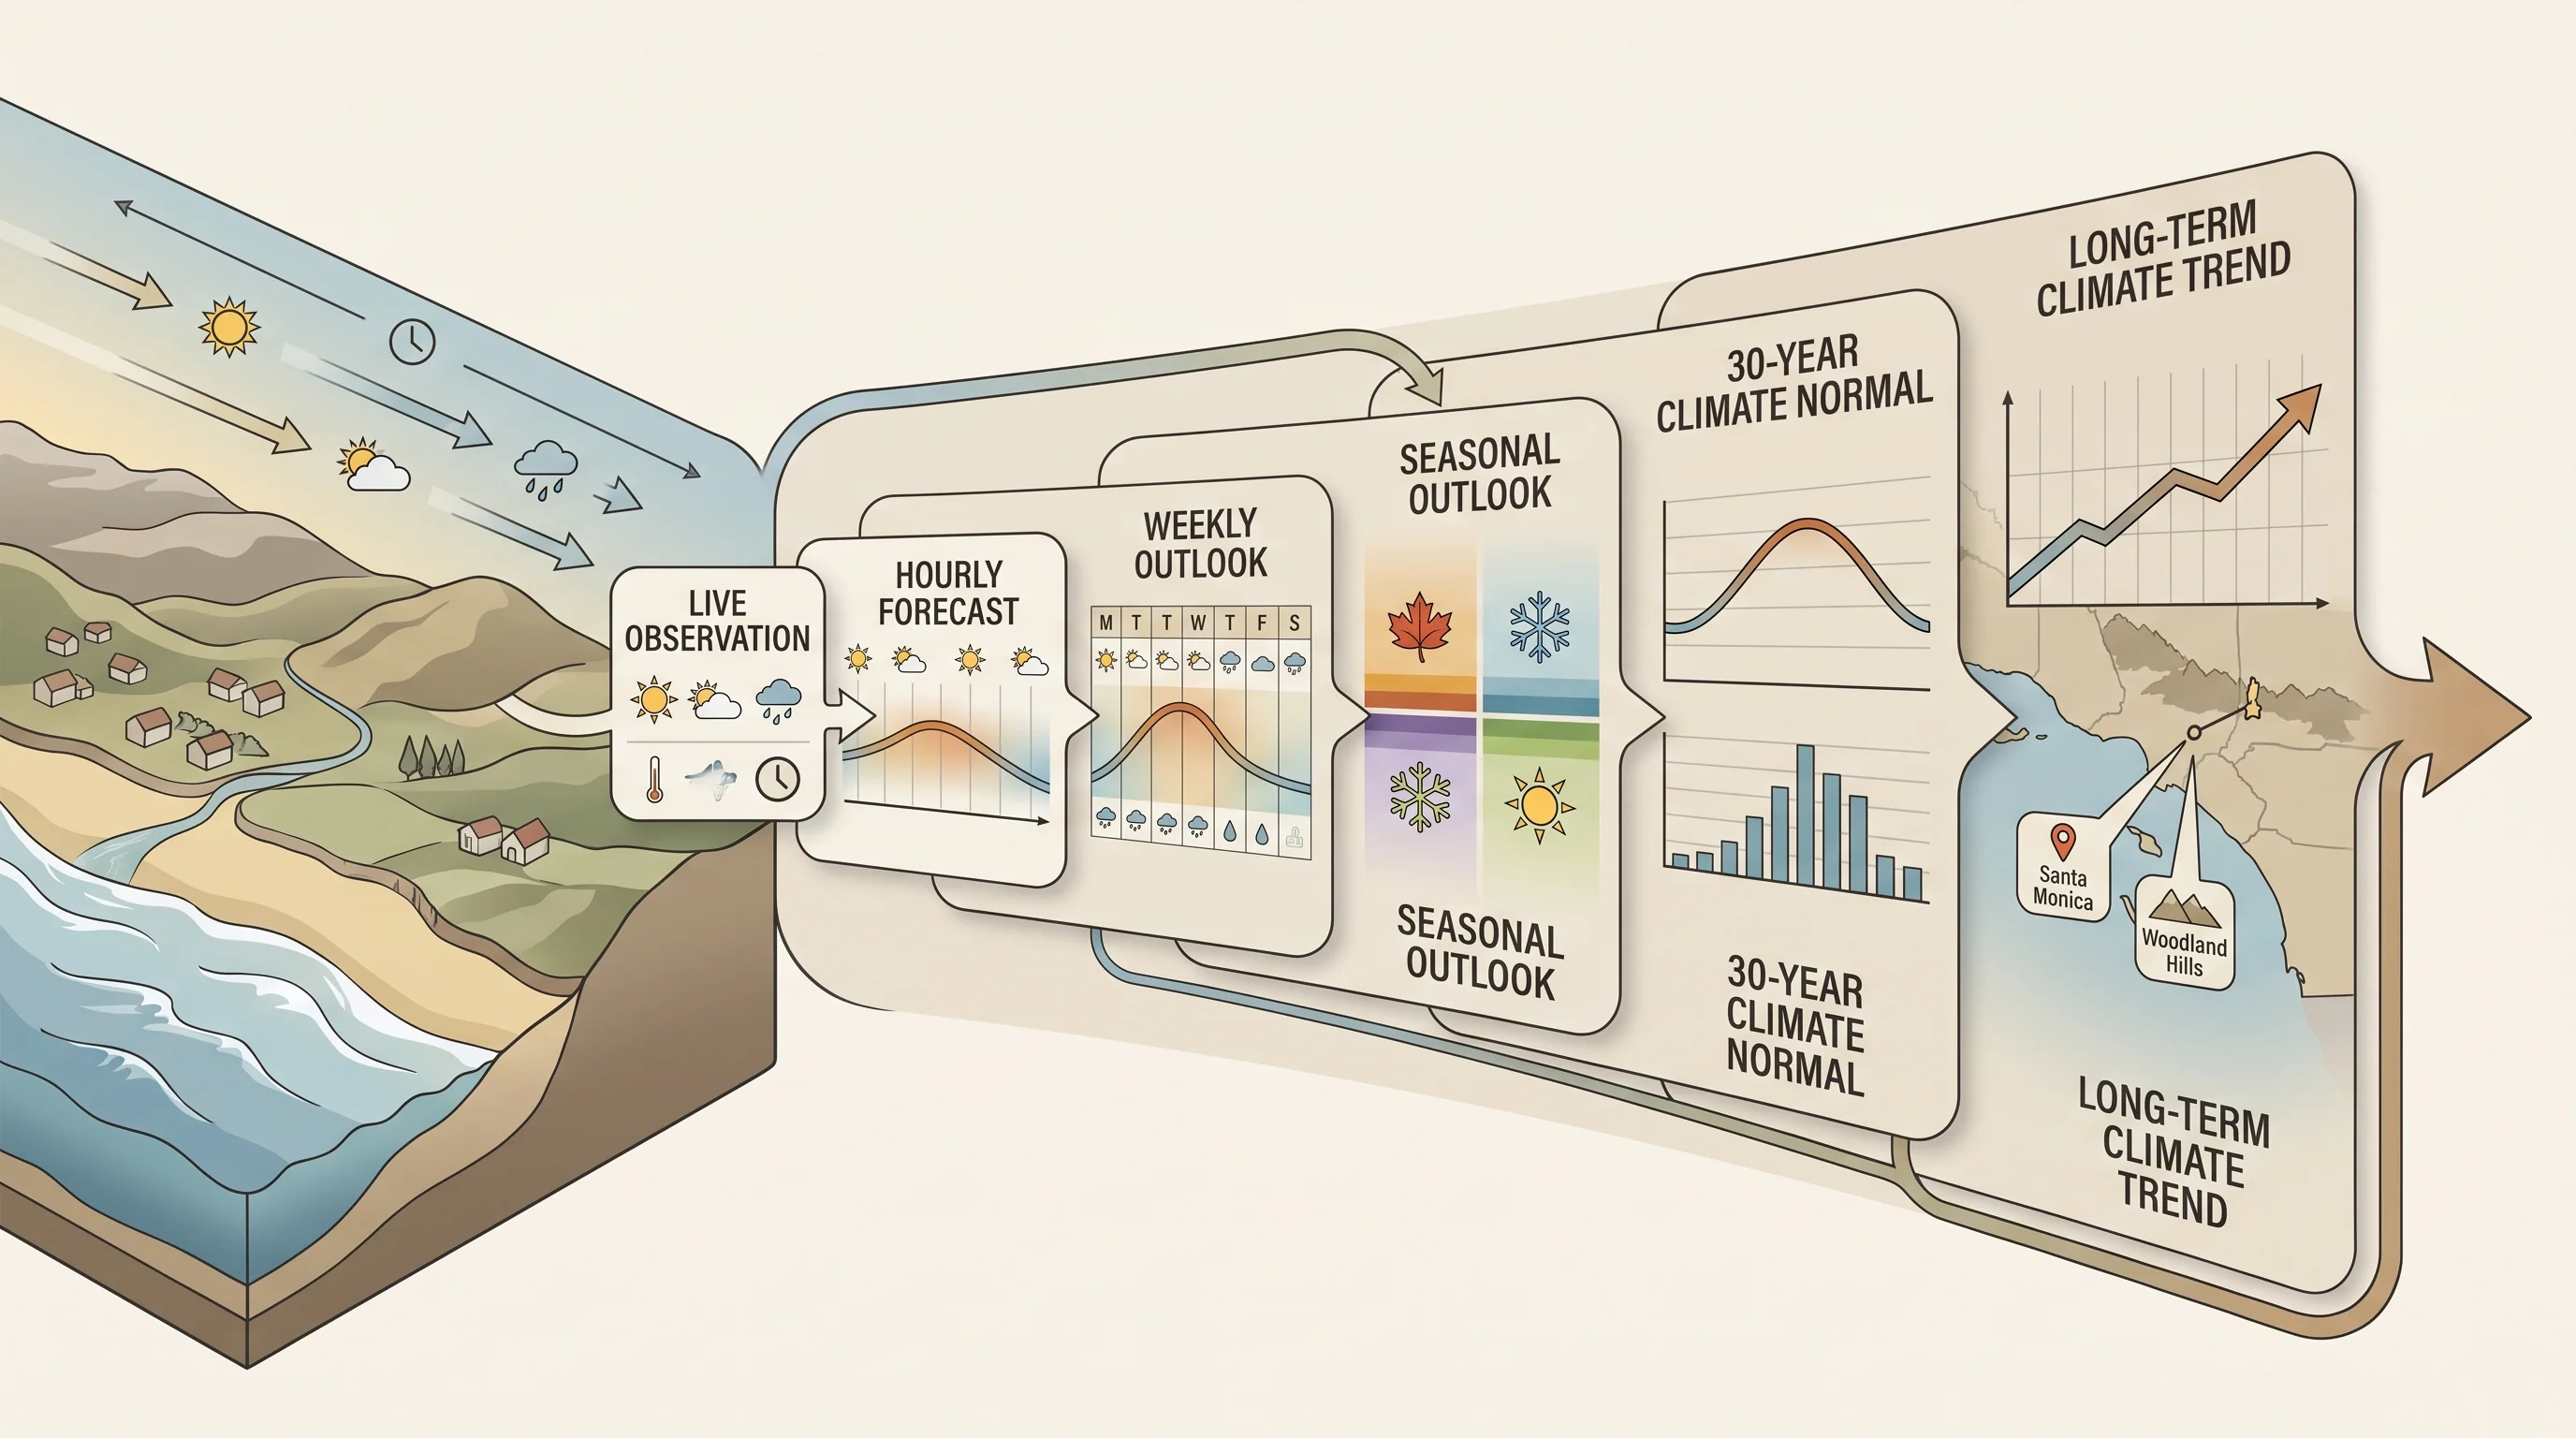
LA microclimates show weather and climate differences at the same time, because permanent geography sets them. Distance from the coast, elevation and the reach of the marine layer create lasting climate differences across the metro area and different daily weather in the same places. Santa Monica, on the coast, and Woodland Hills, in the San Fernando Valley less than 20 miles inland, are the classic local pair.
Santa Monica and Woodland Hills have different climates in their long-term station records. The valley is measurably hotter on an average summer afternoon and colder on a clear winter night than the coast, because the ocean's moderating effect weakens with distance inland. That is climate, built from decades of station data.
The same two places show weather differences on any given afternoon. A marine layer can hold Santa Monica in the low 70s under gray skies while Woodland Hills sits in the 90s under full sun. The coastal cloud deck behind the May Gray and June Gloom season clears, thins or holds depending on very local wind and inversion conditions.
Downtown Los Angeles and Pasadena each have their own normal temperature range and their own weather on a given day. One "Los Angeles weather" number rarely helps someone planning around a specific neighborhood. Climate is what a destination's multi-year record shows is typical; weather is what it is doing this afternoon. Southern California's microclimates make the gap between the two unusually large.
Elevation adds a third factor. A destination a few thousand feet up in the San Gabriel or San Bernardino Mountains has its own cooler, wetter climate and its own weather; it can get snow while the valley below gets rain from the same storm. None of these differences requires a changing climate. Terrain has shaped Southern California's weather and climate this way throughout the instrument record.
The weather pattern over the region changes year to year and day to day. The microclimate map stays consistent: cool, foggy coast, hot, dry valleys and cool mountains that can get snow. That consistency is what makes it climate. Individual storms and heat waves happen against it without resetting it.
Can One Storm Prove or Disprove Climate Change?
One storm cannot prove or disprove climate change. Climate change is a shift in long-term statistical patterns, and any single event still falls within the range of variability that climate has always produced. A record-hot week or a historic atmospheric river is real weather with real local impact. Neither is, by itself, proof of a changed climate, just as one cold morning is not evidence against it.
Event attribution science studies this question. Attribution researchers do not declare a specific storm caused or not caused by climate change. They compare how likely or intense a type of event is in today's climate with a modeled climate without recent warming. They report the result as a change in odds or intensity, such as a heat wave that is now more likely or hotter than it would have been decades ago.
Treating one Southern California heat wave or winter storm as proof of a trend, in either direction, misreads attribution science. Dismissing attribution findings because "it was just one storm" makes the same mistake from the other side.
How Can Climate Change Affect Local Extremes?
Climate change is shifting the background conditions behind Southern California's extremes, according to California's state climate assessments. California's Fourth Climate Change Assessment and related work, including reporting from the California Department of Water Resources, project a warmer statewide baseline that raises the floor and ceiling for heat waves. They also project heavier peak downpours even as rainy days decline, longer and more active fire-weather seasons, continued sea-level rise along the Southern California coast and wider swings between wet and dry years, called precipitation whiplash.
Climate projections shift the odds and upper limits of future extremes; they are not forecasts for any day, storm or season. A hotter baseline makes a heat wave more likely to set a record but does not schedule it. A greater capacity for intense rain raises the ceiling for an atmospheric river but does not guarantee this winter's storms will reach it.
For Santa Ana wind fire weather or flash flooding in Los Angeles, treat climate findings as background, and check a current, dated forecast or warning for any specific event.
Think of climate and weather as two layers. The climate layer sets the limits: how hot a heat wave can get, how much rain an atmospheric river can drop and how dry vegetation can become before a Santa Ana event. The weather layer decides which days test those limits in a given year. A warmer climate does not mean every summer sets a record, and a climate capable of heavier rain does not mean every winter floods.
When the right weather pattern arrives, a warmer, moister atmosphere gives it more room to run than it had decades ago. Keeping the two layers separate lets you treat a hot week or big storm as real news without treating it as a verdict on the whole climate record.
Which Dataset Answers Which Question?
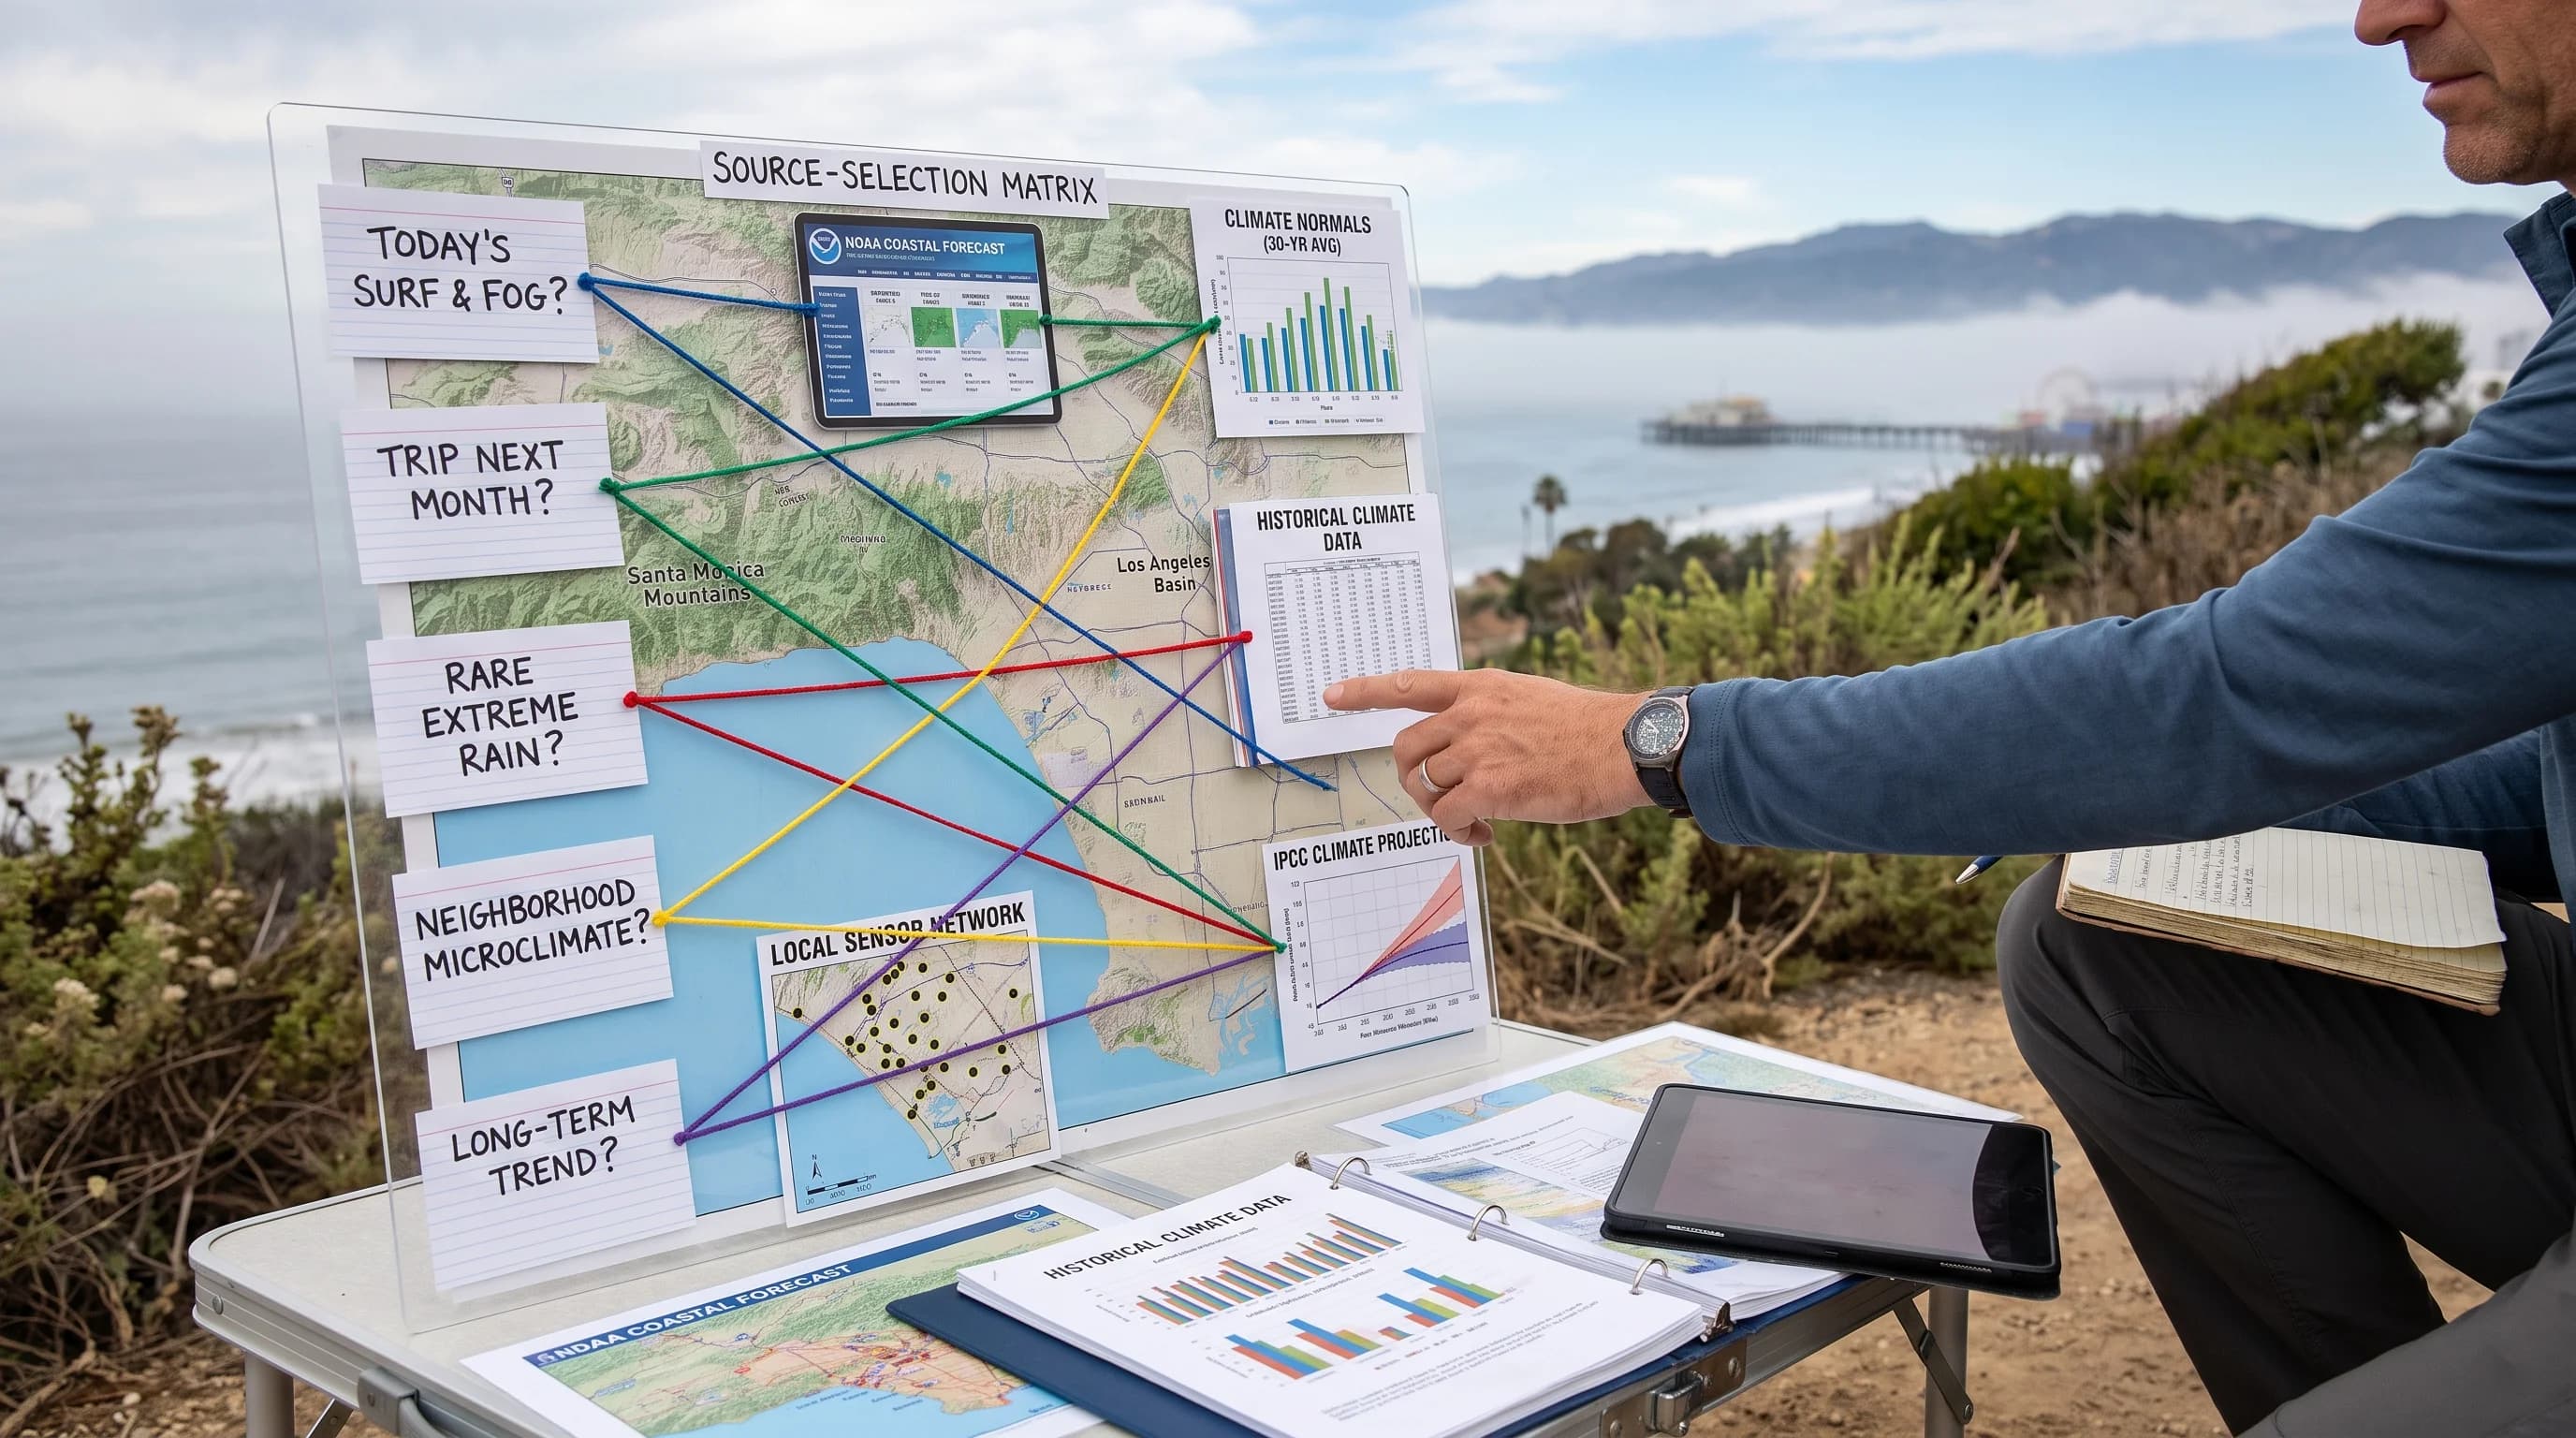
Each weather and climate question needs a different dataset. Plans for today or the next week need a short-range forecast. Plans for a trip next month need climate normals. Claims about a long-term trend need a multi-decade station record or a formal climate assessment, not one season's weather.
| Your question | Best source |
|---|---|
| What will today or this week actually be like? | A point forecast from NWS Los Angeles/Oxnard or NWS San Diego |
| What is typical for a trip next month? | NOAA 1991-2020 Climate Normals for the nearest station |
| Is this an unusually wet, dry, hot, or cold season? | The NOAA Climate Prediction Center seasonal outlook compared with normals |
| Why does my neighborhood differ from the next one over? | Matched destination-level station data, not a single regional headline number |
| Is Southern California's climate actually changing? | California state climate assessments and long-term NOAA/NCEI station trends |
Forecasts, normals and climate records do not compete or substitute for each other. A seasonal outlook from the NOAA Climate Prediction Center can say a winter will likely be wetter than normal without saying whether it will rain next Tuesday. An El Niño or La Niña signal works the same way, shifting a winter's odds without fixing any storm. A climate normal cannot tell you whether you need a jacket tomorrow, and tomorrow's forecast cannot tell you whether this August is hotter than the last thirty.
Southern California's microclimates mean both weather and climate differ from one destination to the next. Match each question to its timescale: a dated forecast for today and this week, climate normals for a typical month and a multi-decade record or state assessment for a real trend. Check current conditions and short-range forecasts for any Los Angeles destination on WeatherLA, and use climate normals to judge what a typical visit feels like.