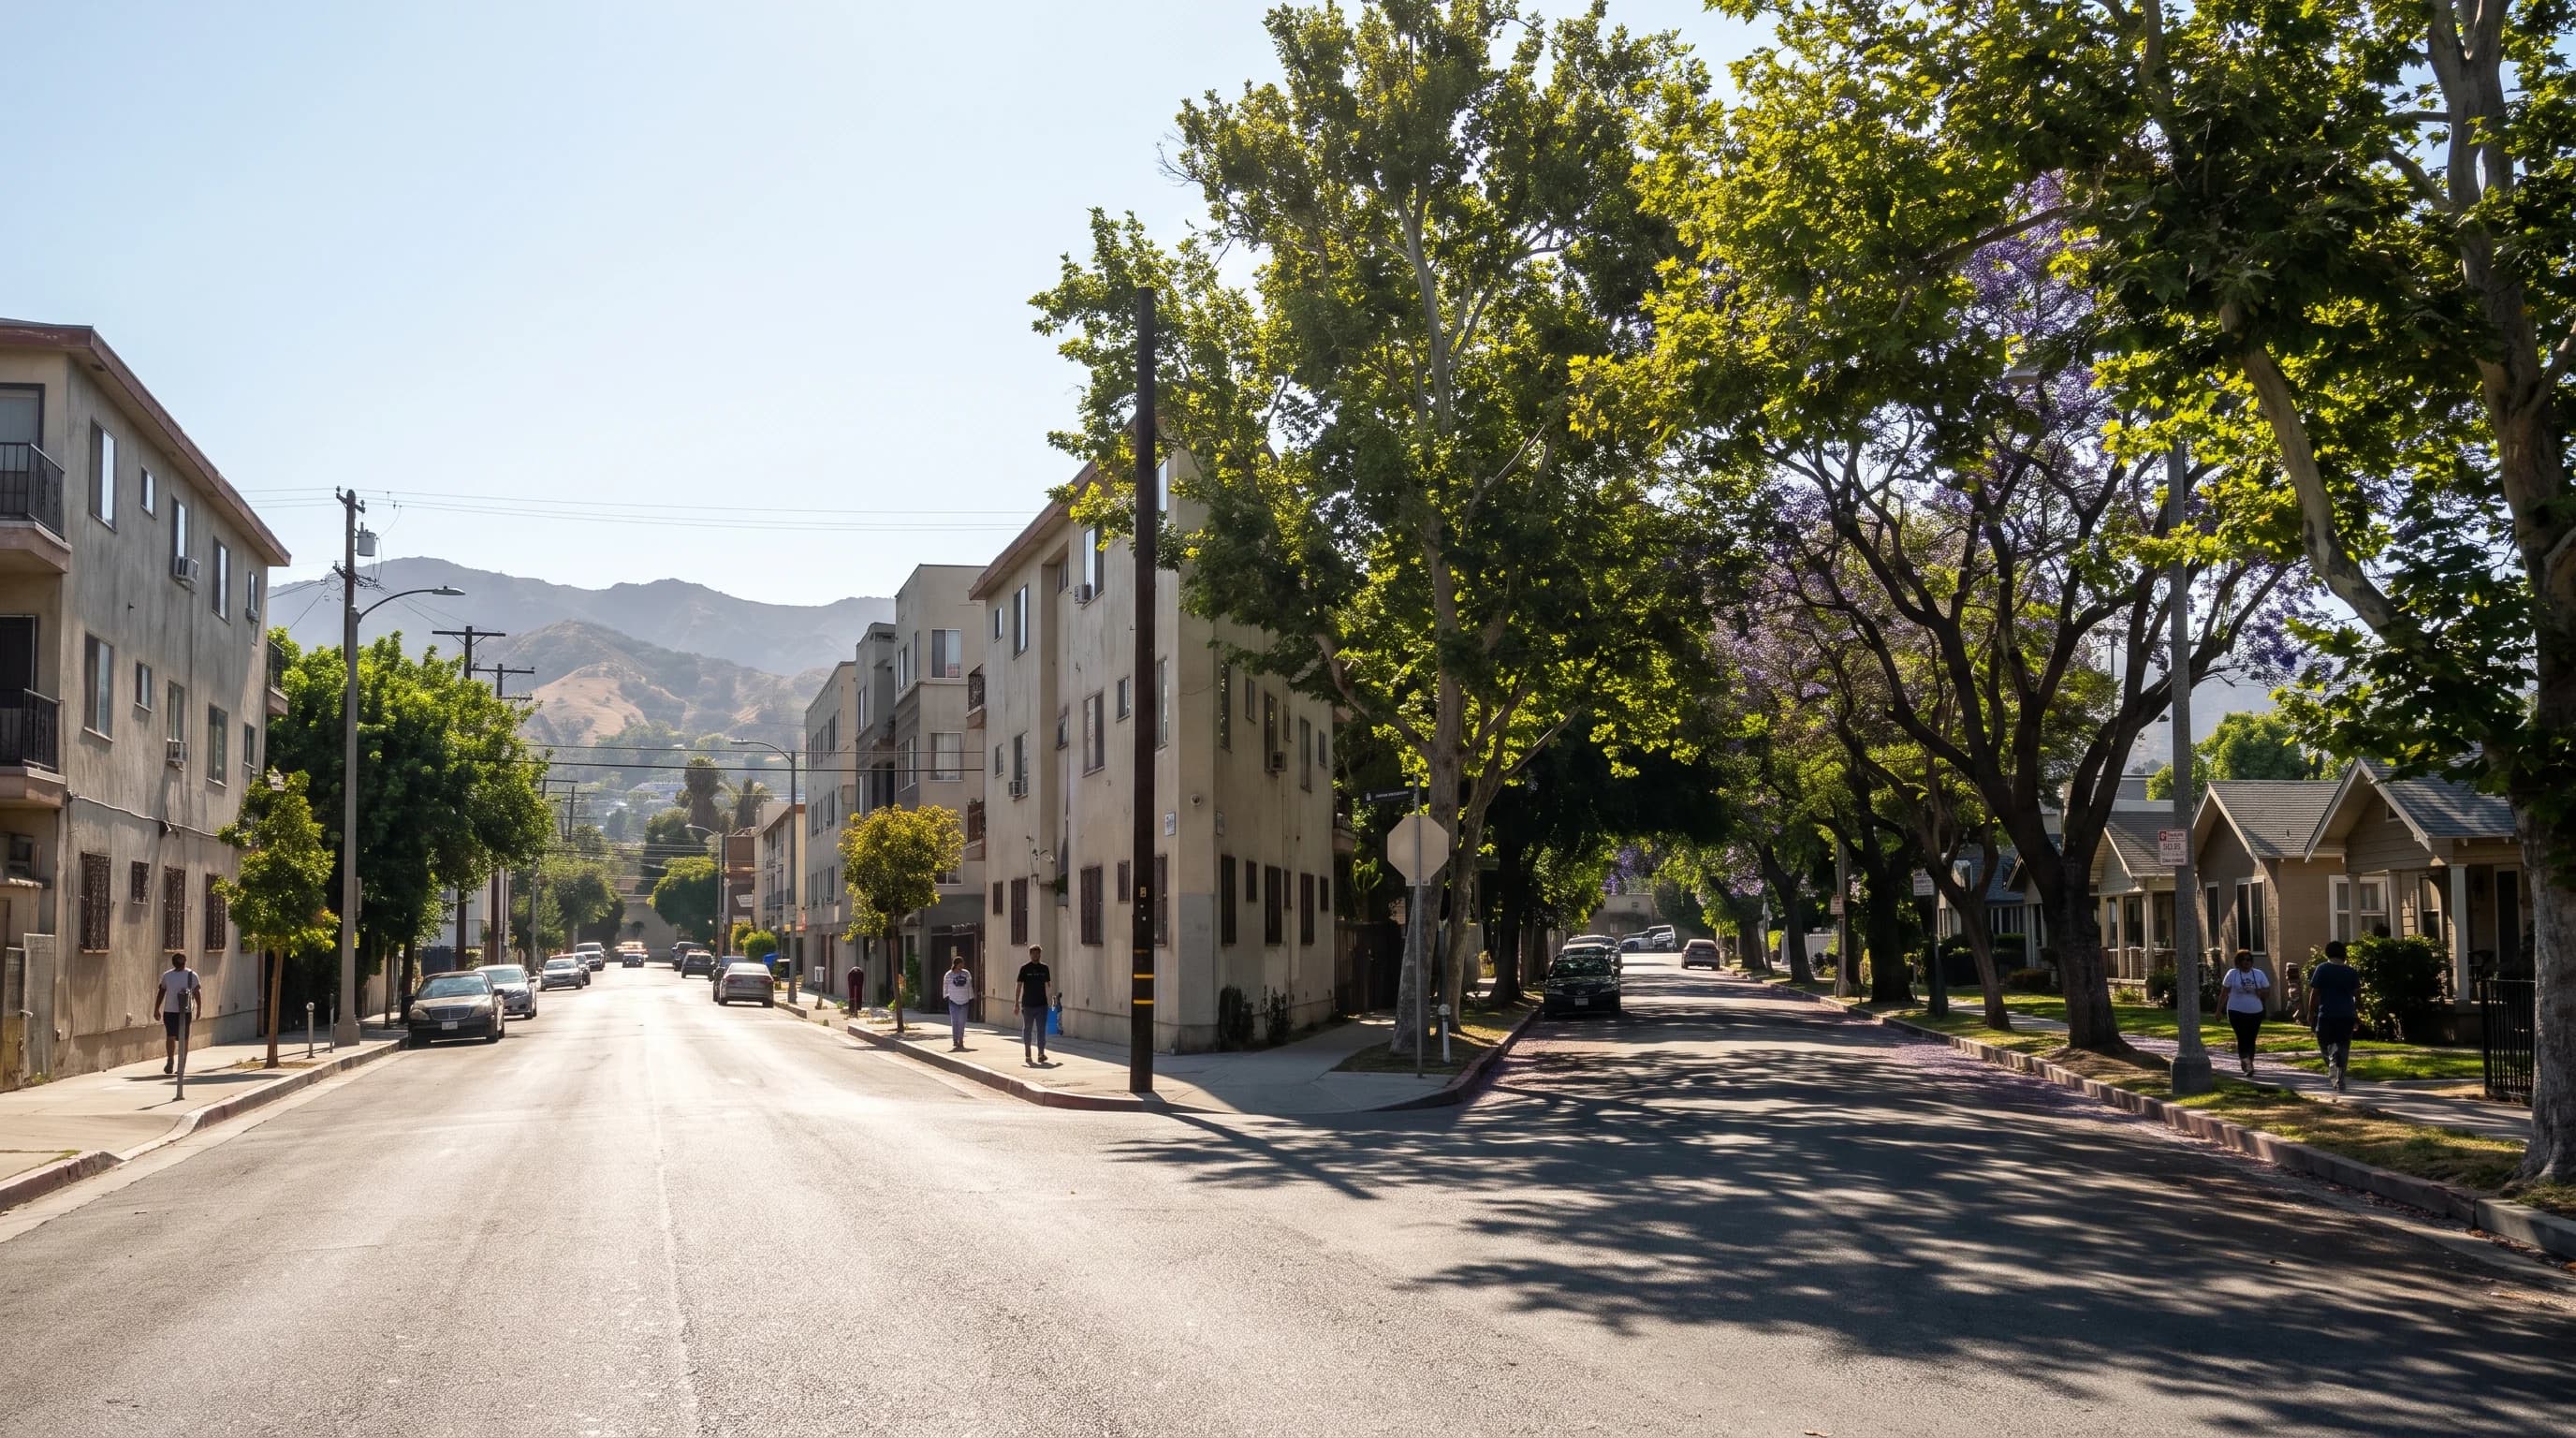
An urban heat island is a built-up area that stays warmer than the less-developed land around it, because pavement, roofs, buildings and human activity absorb, store and release heat differently than soil and plants. In Los Angeles, heat islands show most clearly after dark. Dense, paved neighborhoods with few trees can stay noticeably warmer overnight than greener areas nearby under the same weather. The heat island effect is real and measurable, but it sits on top of LA's much larger coastal-to-inland climate gradient.
What Is the Urban Heat Island Effect?
The urban heat island effect is the tendency of cities to run warmer than nearby rural or less-developed land, because pavement, roofs, buildings and fewer plants change how the ground absorbs, stores and releases heat. The EPA uses that definition nationally, and it applies in Los Angeles too. How big the effect looks depends on what is measured.
Surface temperature and air temperature are different measurements. A satellite measures land-surface temperature: how hot a rooftop or asphalt is when the satellite passes over.
A weather station or mobile sensor measures air temperature a few feet above the ground, the air people breathe. A parking lot's surface can be 40°F to 50°F hotter than the air above it on a sunny afternoon. The air temperature difference between a paved commercial strip and a shaded park a few blocks away is usually only a few degrees.
Every heat island claim depends on which temperature it reports, the time of day, the season and what area it uses for comparison. The EPA's national ranges explain how heat islands work but do not measure any specific Los Angeles neighborhood.
What Causes Los Angeles Heat Islands?
Los Angeles heat islands come from several overlapping causes. Dark roofs, asphalt and concrete reflect little sunlight, so they absorb much of it instead of bouncing it back to the sky. Los Angeles has enormous areas of roof, road and parking lot, so that absorbed heat builds up across whole neighborhoods on a sunny day.
Losing plants makes it worse. Trees and plants cool the air by releasing water vapor, a process called evapotranspiration that works like sweat cooling skin.
Where tree canopy and watered landscaping are thin, that cooling is mostly missing, and Los Angeles neighborhoods vary widely in tree cover. Dense buildings add more heat. Tall, closely spaced buildings trap heat between them, slow the nighttime airflow that would cool a neighborhood and expose more surface to the sun.
Vehicles, air conditioners and industry also release waste heat directly. Waste heat is highest on the same hot afternoons and evenings when air conditioning use peaks.
Southern California's dry summers add another factor. Evapotranspiration needs moisture, and during LA's rainless summer and fall, unwatered soil and plants dry out and cool the air less. That is why watered parks and street trees matter so much in a Mediterranean climate like Los Angeles: they supply the moisture that cools the air.
| Urban feature | Heat mechanism | Los Angeles relevance |
|---|---|---|
| Dark roofs and pavement | Absorb solar energy and release it later | Large areas of roofs, roads, and parking lots |
| Limited trees and vegetation | Less shade and evapotranspiration | Uneven canopy between neighborhoods |
| Dense buildings and street geometry | Store heat and can limit longwave cooling or airflow | Built-up commercial and residential corridors |
| Vehicles, buildings, and air conditioning | Add waste heat | Dense traffic and cooling demand during hot periods |
| Trees, cool roofs, and reflective surfaces | Increase shade, evapotranspiration, or solar reflectance | Local mitigation programs and building standards |
Why Do Some Los Angeles Neighborhoods Stay Hotter Than Others?
Some Los Angeles neighborhoods stay hotter than others because of two separate factors: how the neighborhood is built and where it sits in the region's climate. How it is built, its tree canopy, pavement and building density, creates the heat island. Where it sits, its distance from the ocean, elevation and terrain, has a much larger effect. That coast-to-valley gradient makes LA one of the most climatically varied metro areas in the country, regardless of pavement.
Downtown Los Angeles shows the built-environment side: dense commercial buildings, wide pavement and little street tree canopy in its core, the classic ingredients of a local heat island.
Pasadena sits farther from the ocean and higher against the San Gabriel foothills, which shapes its temperatures regardless of how built-up any block is. Woodland Hills and Van Nuys, well inland in the San Fernando Valley, run hot in summer mainly because they are far from the ocean's cooling; an undeveloped patch of the same valley would too. Long Beach sits near the coast, where onshore marine air keeps afternoons and evenings well below inland temperatures and can outweigh its own heat island.
No single dataset compares these places on surface type, time of day and season, so they illustrate the two effects rather than rank the hottest. The City of Los Angeles Climate Vulnerability Assessment documents heat exposure across city neighborhoods with a clear method, and it is a better starting point than informal rankings.
Why Is the Urban Heat Island Often Strongest at Night?
The urban heat island is often strongest at night because concrete, asphalt and masonry store a lot of heat during the day and release it slowly after sunset. That stored heat warms the air above pavement and buildings for hours into the night. Plants and open land store less heat and lose it quickly after dark. Dense, paved neighborhoods can therefore stay measurably warmer at 11 p.m. or 2 a.m. than a nearby park, even when both reached similar daytime highs.
Warm nights matter for health, because the body recovers from daytime heat during cooler nights. City heat-safety guidance treats overnight lows as part of how dangerous a hot spell is. A warm night in Los Angeles does not by itself prove a heat island. Offshore wind, humid air from the south or a heat wave over the whole basin can keep nights warm everywhere, regardless of pavement or trees.
The urban heat island is best measured as the difference between two nearby places under the same weather, not as the reason a night is hot.

How Do Scientists Map an Urban Heat Island?
Scientists map urban heat islands in four main ways, and each shows something different. Satellite maps show land-surface temperature, how hot rooftops and pavement are when the satellite passes, usually around midday.
Mobile campaigns drive vehicle-mounted sensors along fixed routes at set times to measure the air people breathe. Fixed weather station networks record air temperature at set points. Modeled indices combine land cover, tree canopy and population to estimate relative heat risk without measuring temperature everywhere.
The EPA's guidance on measuring heat islands says these products are not interchangeable. A credible map states its time of day, season, resolution and whether it shows surface or air temperature. A midday satellite image of a hot parking lot cannot prove that a neighborhood's air stays warm at 2 a.m.; those are different measurements. Before drawing conclusions from any heat map, check its source, year and metric.

Is an Urban Heat Island the Same as a Heat Wave or Climate Change?
An urban heat island is not a heat wave or climate change. A heat wave is a regional weather event, days of unusual heat driven by patterns like a heat dome over a metro area or larger region. Climate change is a long-term shift in average conditions and extremes over decades. The urban heat island is a local effect of how an area is built and covered, and it exists on ordinary days, not only during heat waves.
The three add together. A heat wave raises temperatures across every neighborhood, and a heat island adds extra warmth where pavement and buildings are densest, especially at night. Climate change is changing how often and how intensely heat waves occur. Blaming one neighborhood's hot night on any single cause requires knowing the regional weather and how the area is built.
How Can Los Angeles Reduce Urban Heat?
Los Angeles can reduce urban heat with trees, cool roofs, cool pavement and shade, and each works differently. Trees provide shade and evapotranspiration cooling and are the best-established tool. Trees need water and ongoing care, and a young tree takes years to provide real shade, which matters where irrigation is costly.
Cool roofs reflect more sunlight, cooling the roof and the building below it. Their effect on neighborhood air temperature depends on how many roofs in the area use them; one reflective roof helps its own building far more than the block. Cool pavement is newer and less standardized. Early results show lower surface temperatures, but performance varies with material, traffic wear and local conditions.
Shade structures, cooling centers and heat-relief programs protect people during dangerous heat, but they help people cope with heat rather than reducing the heat island itself. The EPA's guide to reducing heat islands explains how these strategies fit together.
How Should Residents Plan Around the Heat Island Effect?
To plan around the heat island effect, use current forecasts and heat alerts, not heat island maps. The heat island explains why your block may feel hotter at 9 p.m. than a friend's a few miles away. For day-to-day decisions, use current forecasts, official heat alerts and City of Los Angeles extreme-heat guidance on cooling centers and heat safety, along with your own health needs and access to air conditioning or shade.
To choose where to spend a hot afternoon or evening in Los Angeles, compare current temperatures and forecast overnight lows across specific destinations, which reflect both the regional weather and local conditions. Check WeatherLA's current conditions and overnight lows for the neighborhoods you are considering, along with National Weather Service heat alerts.