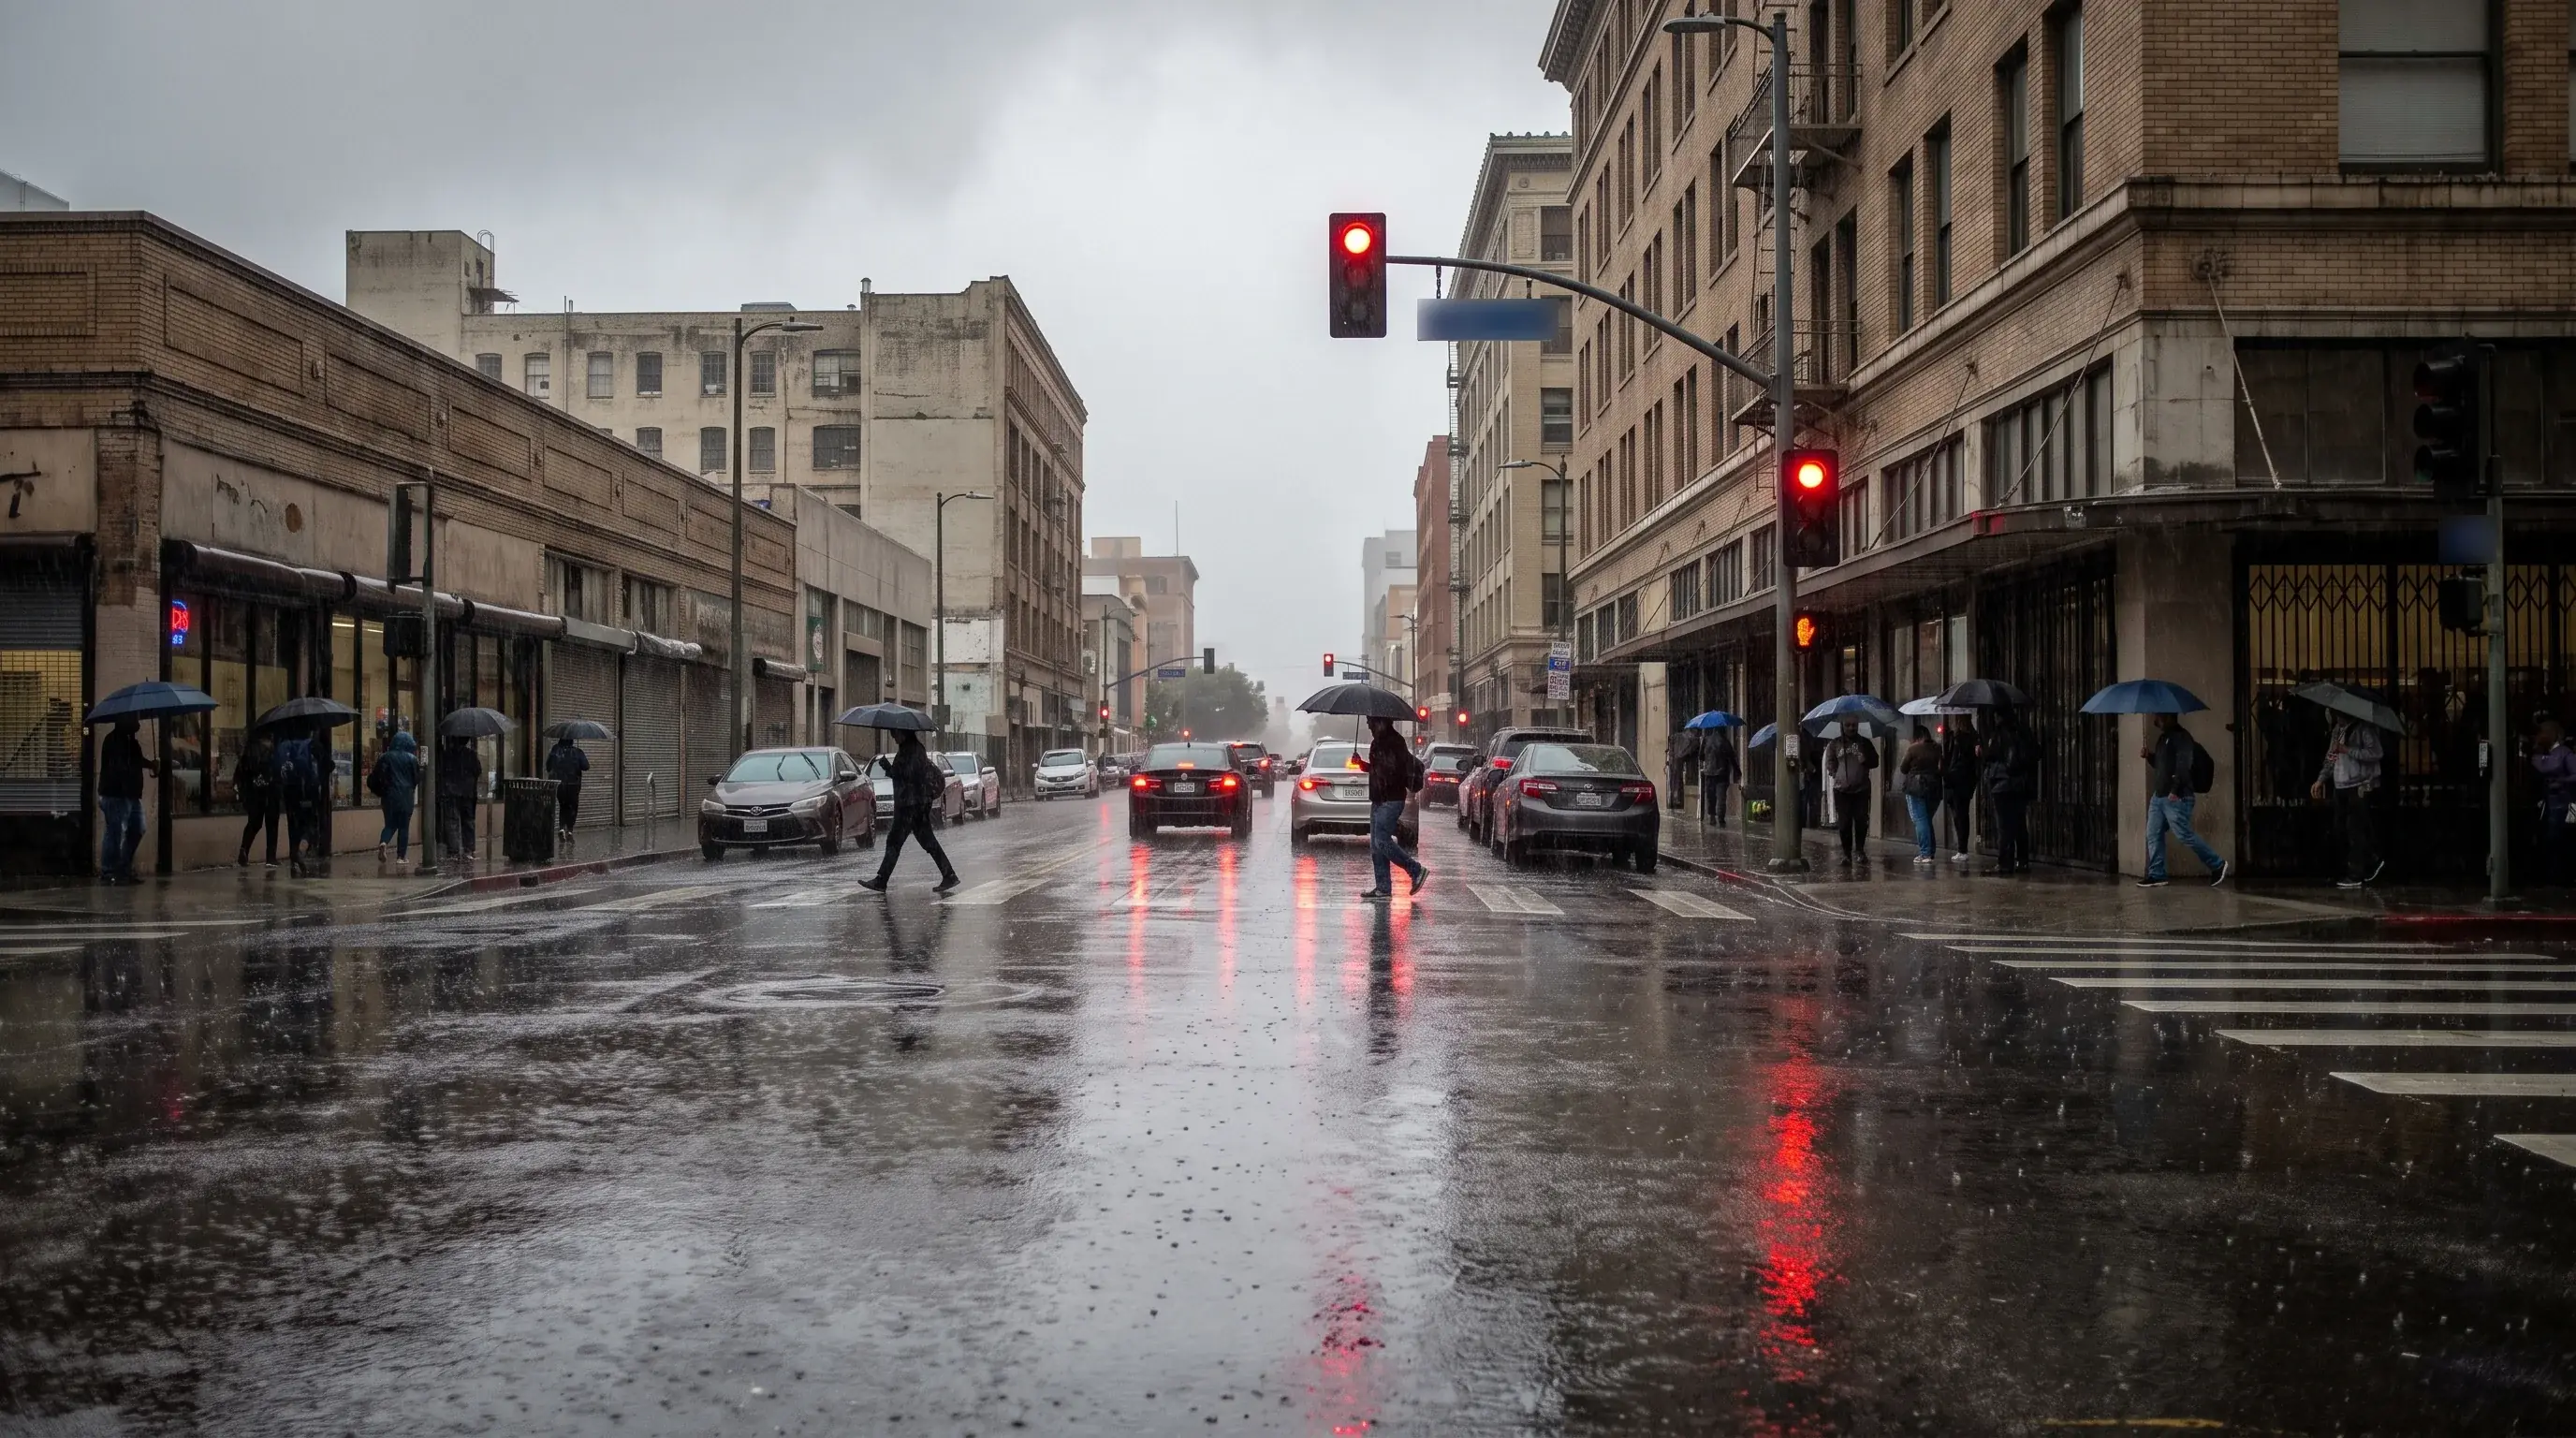
Downtown Los Angeles averages 14.25 inches of rain in a water year, the October-to-September calendar the National Weather Service uses, and about 82% of it falls between December and March. The 2025-26 water year brought 19.73 inches to the Downtown gauge through September 28, 2026, roughly 138% of normal. The year before brought only 8.26 inches. Swings this large are normal for Los Angeles.
From October 1, 2024 to the morning the Palisades and Eaton fires started on January 7, 2025, Downtown recorded 0.16 inch of rain. Eleven months later, a single Christmas Eve storm dropped 2.58 inches. The average hides both extremes. This guide covers the normal total, how the 2025-26 season compared, the records, and why your own rain gauge rarely matches the official one.
How Much Rain Does Los Angeles Get in a Normal Year?
Los Angeles gets 14.25 inches of rain in a normal year at the Downtown station. That figure is the 1991-2020 normal published by NOAA's National Centers for Environmental Information.
February is the wettest month at 3.64 inches, followed by January (3.29), December (2.48) and March (2.23). Those four months bring 11.64 inches. June through September together average less than a quarter inch, and August averages nothing at all. For how to capture rain at home, see California rainwater collection rules.
Rain days are rarer than most visitors expect, as the month-by-month weather guide shows. Downtown averages about 34 days a year with at least a hundredth of an inch, and only about 21 with a tenth of an inch or more. A typical winter brings a few real storms with long dry, sunny spells between them, which is why a wet LA winter comes down to a few big storms and why one storm can make or break a season.
| Month | Normal rainfall | Days with measurable rain |
|---|---|---|
| October | 0.58 in | 2 |
| November | 0.78 in | 3 |
| December | 2.48 in | 6 |
| January | 3.29 in | 6 |
| February | 3.64 in | 6 |
| March | 2.23 in | 5 |
| April | 0.69 in | 3 |
| May | 0.32 in | 2 |
| June | 0.09 in | under 1 |
| July | 0.02 in | under 1 |
| August | 0.00 in | under 1 |
| September | 0.13 in | under 1 |
| Water year | 14.25 in | About 34 |
How Did the 2025-26 Rain Year Compare With Normal?
The 2025-26 rain year was wet: Downtown Los Angeles got 19.73 inches, about 138% of normal, and most of it fell by the end of February. The season opened with 1.38 inches on October 14, 2025, more than two Octobers' worth of rain in a day.
November brought 5.53 inches in a run of mid-month storms, the fifth-wettest November in Downtown records that go back to 1877. December added 4.70 inches, including 2.58 on Christmas Eve, when forecasters flagged a rare high risk of excessive rainfall for parts of the LA Basin. January added 2.47 inches and February 4.25, including 1.91 on February 16 alone.
Then it stopped raining. March through August brought only 0.62 inch combined. The only notable late rain came on September 6, 2026, when moisture from Hurricane Marie left 0.71 inch Downtown. At LAX, the National Weather Service's daily climate report shows 14.18 inches since October 1, compared with a normal of 12.22 inches.
Across the region, totals ranged from about normal in San Diego to more than 150% of normal in Burbank; see Southern California rainfall totals by city.
The previous season was the opposite. In 2024-25, Downtown got 8.26 inches, 58% of normal. Only 0.27 inch fell from October 1 to January 25, the third-driest start to a season on record after 1903-04 and 1962-63. The 2026-27 water year begins October 1.
NOAA gives a very strong El Niño better than 90% odds, which makes a wet Southern California winter more likely but does not guarantee one. The El Niño versus La Niña explainer covers why.
Why Does LA Rarely Have a Normal Rain Year?
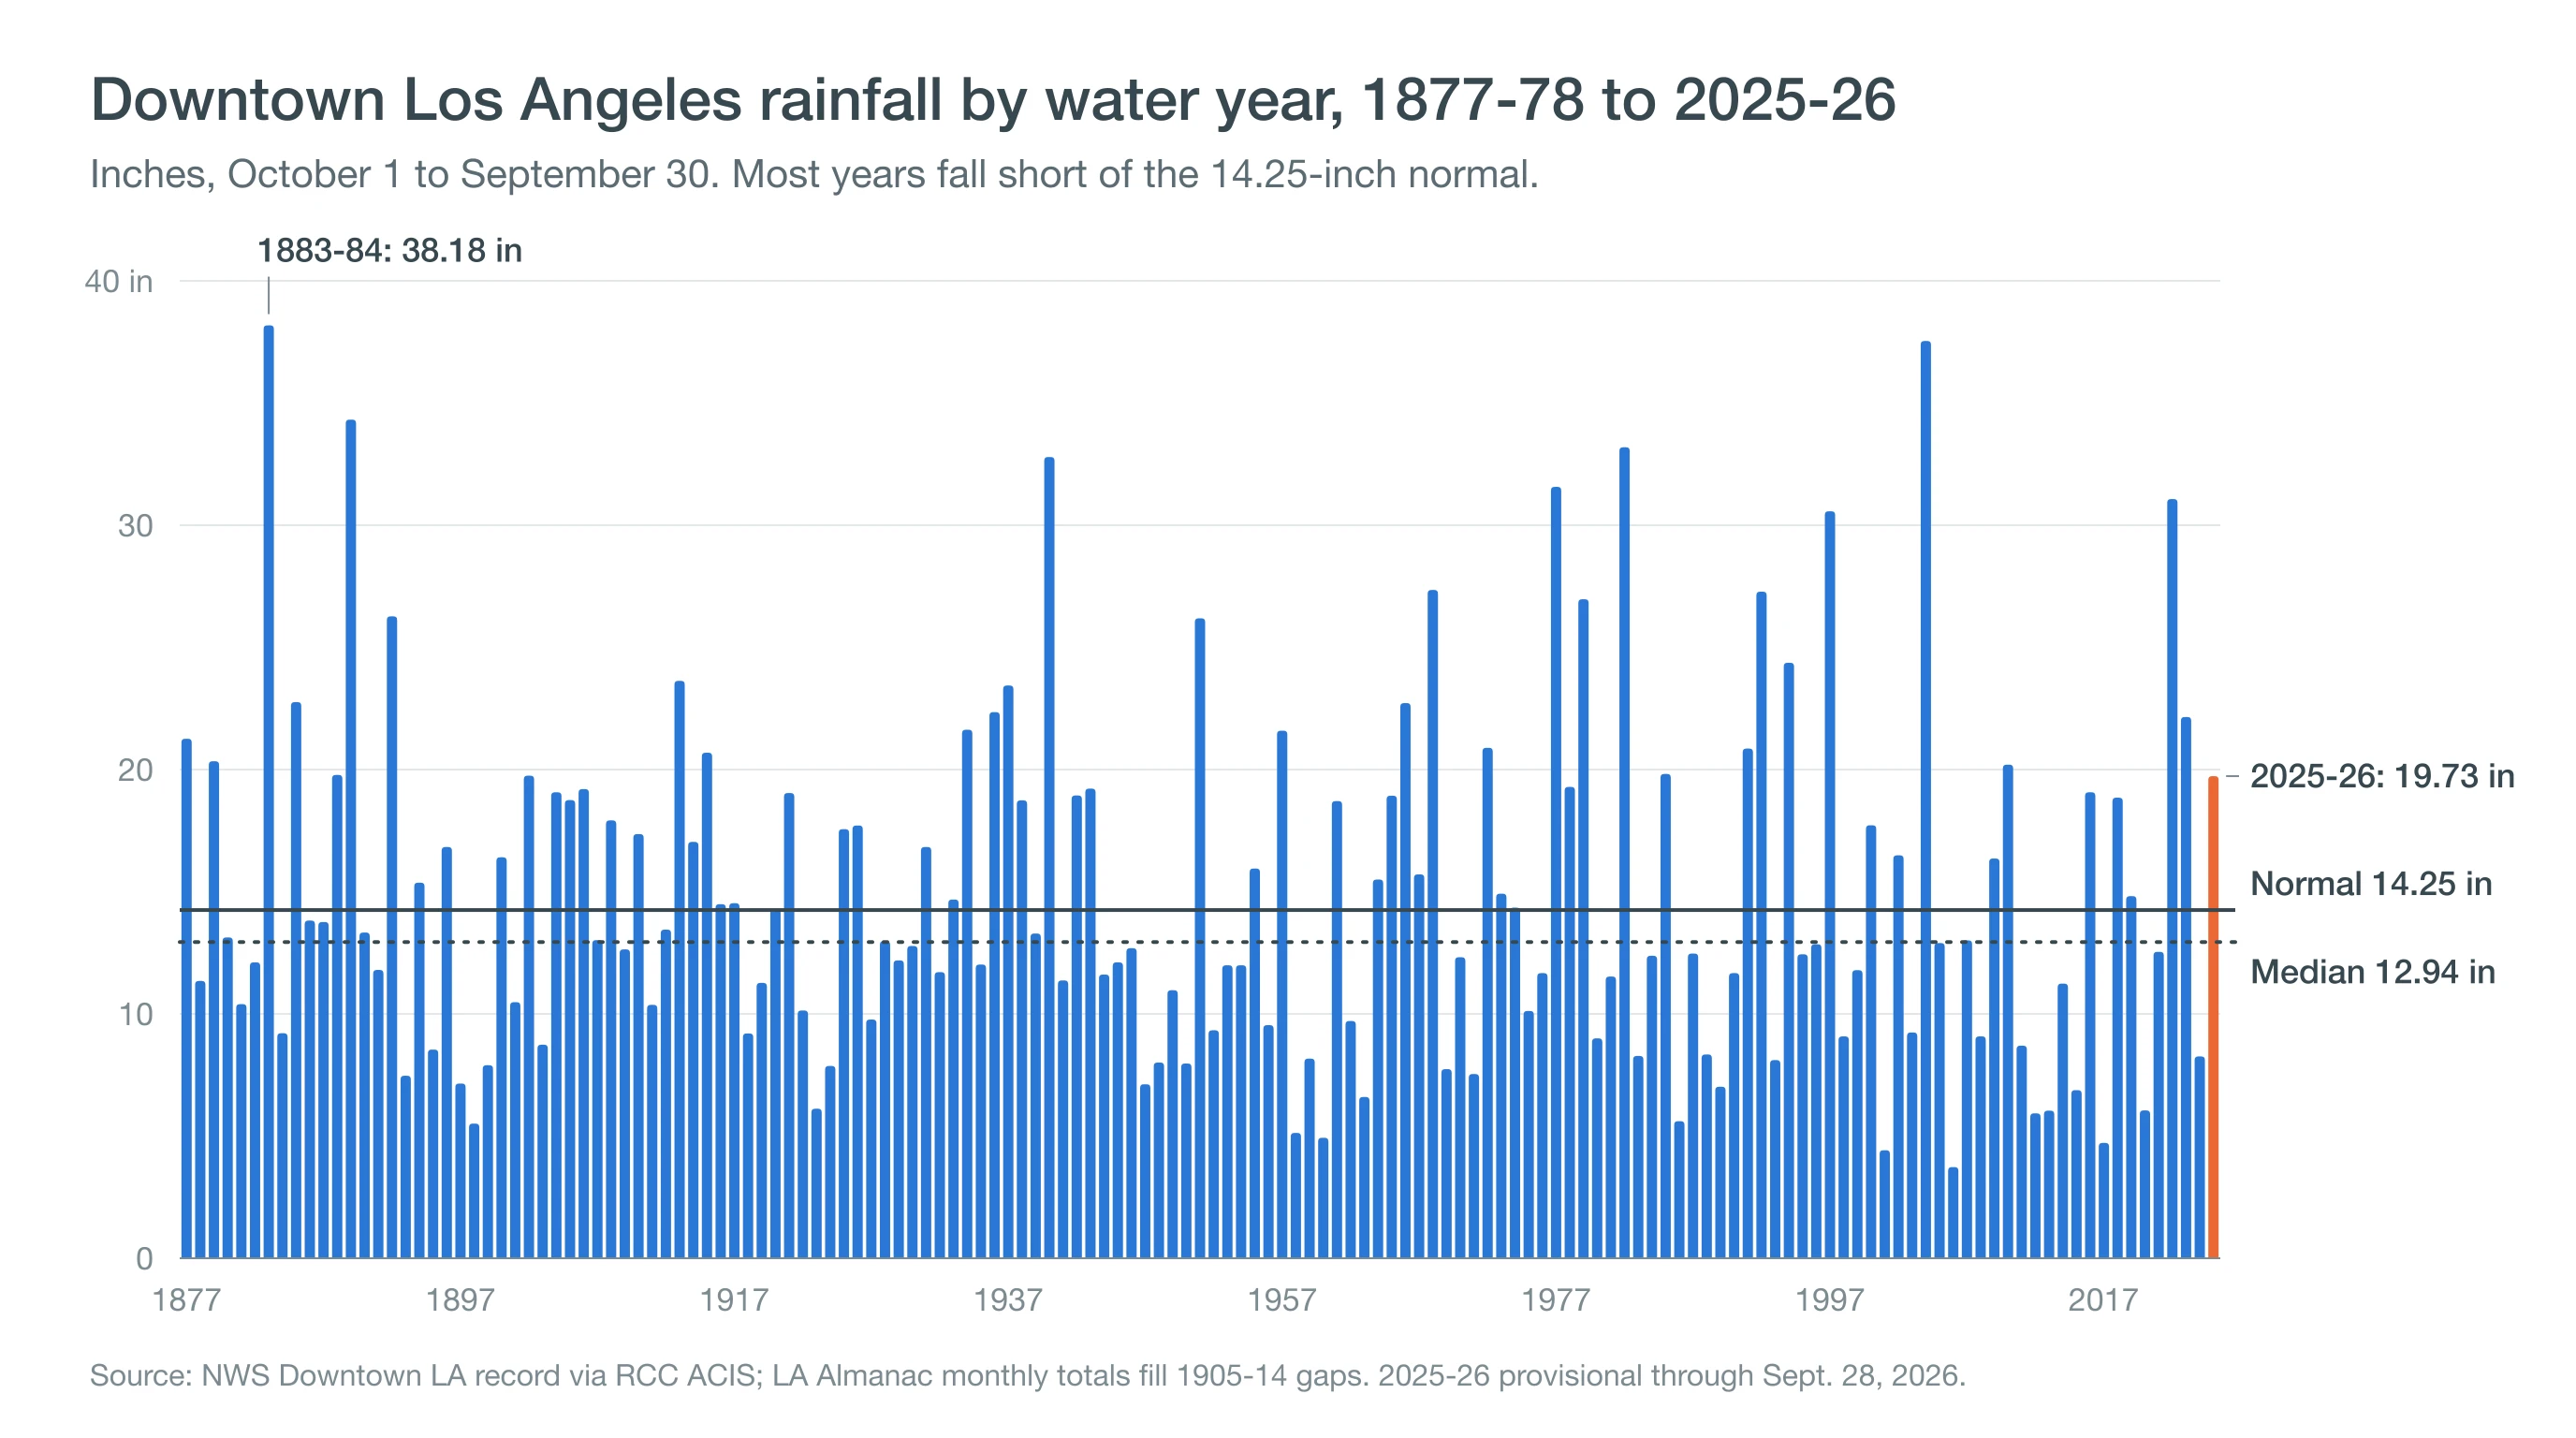
Los Angeles rarely has a normal rain year because a few enormous winters pull the 14.25-inch average above what a typical season brings. Across every Downtown water year from 1877-78 through 2024-25, the median, or middle value, is 12.94 inches, more than an inch below the 14.25-inch normal. Of those 148 seasons, 83 finished below normal.
Of the 30 seasons from 1995-96 to 2024-25, 19 finished below normal. Only 20 of the 149 seasons through 2025-26 came within 10% of normal, about one year in seven. The biggest flood of all came before the record began: the Great Flood of 1862.
A below-normal year is the typical LA year, and a few very wet winters make up the difference. The last four seasons show the pattern: 31.07 inches in 2022-23, 22.15 in 2023-24, 8.26 in 2024-25 and 19.73 in 2025-26. None of them came within a third of the average. When a January headline says Los Angeles is behind normal, that is typical.
What matters is whether the big storms arrive later in the season. When they do not, drought follows, as described in how Southern California droughts take hold.
What Were the Wettest and Driest Years in Los Angeles History?
The wettest water year on record is 1883-84, with 38.18 inches at Downtown. The runner-up is 2004-05 at 37.54 inches. Behind them come 1889-90 (34.32), 1982-83 (33.19), 1940-41 (32.79), 1977-78 (31.57), 2022-23 (31.07) and 1997-98 (30.57), the winter of the famous El Niño. Most of these seasons came from atmospheric rivers arriving one after another.
The driest was 2006-07, with just 3.73 inches, followed by 2001-02 (4.42), 2017-18 (4.72), 1960-61 (4.93) and 1958-59 (5.13). The wettest season brought more than ten times as much rain as the driest.
Single months and days show the same extremes. December 1889 is still the wettest month on record at 15.80 inches, ahead of January 1969 (14.94) and February 1998 (13.68). The wettest day was March 2, 1938, when 5.88 inches fell during the flood that led officials to turn the Los Angeles River into a concrete channel. And on August 20, 2023, Tropical Storm Hilary dropped 2.48 inches, giving Downtown its wettest August ever.
Rain Season or Water Year: Why Do Two Sources Give Different Totals?
Two sources give different LA rainfall totals because they add up rain over different 12-month calendars. The National Weather Service counts the water year, October 1 to September 30. The Los Angeles Almanac and many older sources count the rain season, July 1 to June 30, the traditional California calendar. Most years the two totals are close because summer is so dry, but a summer storm can split them.
Tropical Storm Hilary is the clearest example. Its 2.99 inches in August 2023 count toward the 2022-23 water year but the 2023-24 rain season.
Because of Hilary, the 2023-24 winter shows 22.15 inches on the NWS calendar and 25.19 inches on the July-to-June calendar. Before comparing two totals, check which calendar each one uses. This page uses the water year throughout.
Why Doesn't the Official Total Match My Neighborhood?
The official Downtown total often differs from your neighborhood because rain varies across short distances and because the official gauge has moved twice. Downtown's weather was measured at the Department of Water and Power building until August 1999, then on the USC campus until May 20, 2024. On that date, the National Weather Service moved it to the Frank Hotchkin Memorial Training Center in Elysian Park, on the south side of Dodger Stadium near Echo Park. NWS said the USC site sat too close to the ocean's influence to represent downtown. A study of the 1999 move found the USC gauge ran about 0.77 inch per year drier than the old site, enough, the authors concluded, to keep 2004-05 from setting the all-time record.
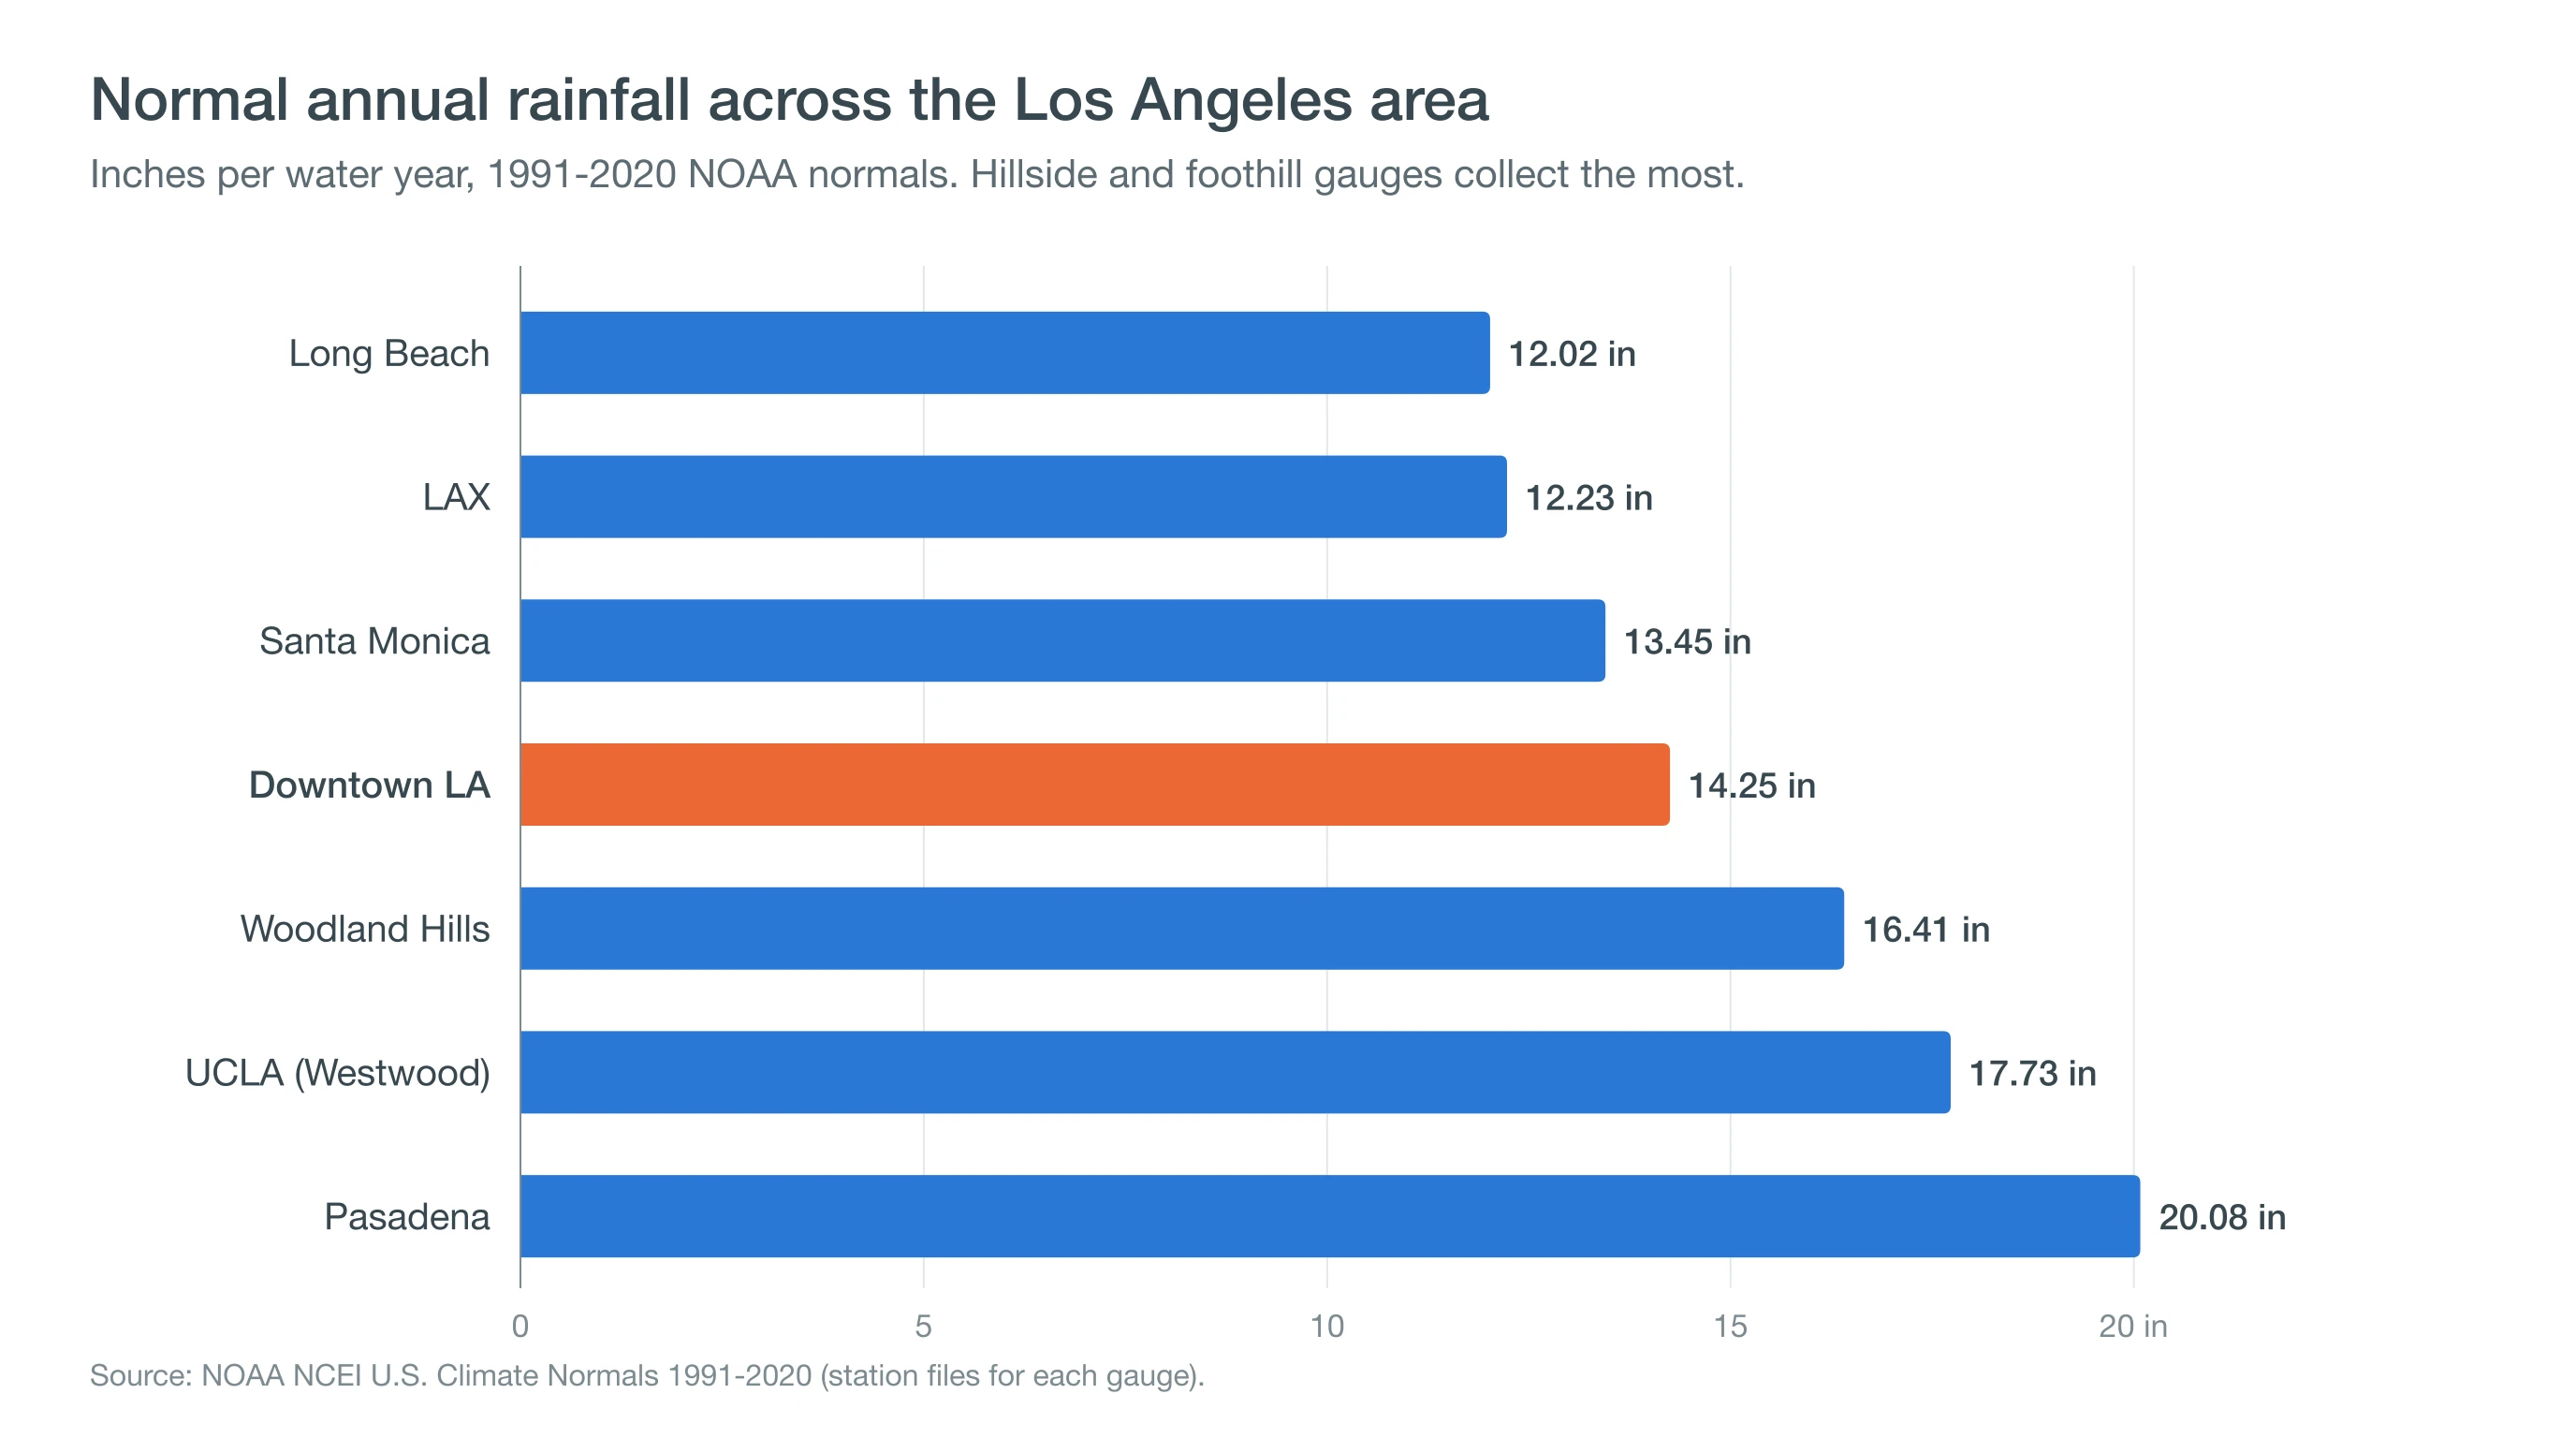
Rain totals also change quickly across the basin. Normal annual rain runs about 12 inches at Long Beach and LAX, 13.45 in Santa Monica, 14.25 Downtown, 16.41 in Woodland Hills, 17.73 at UCLA and 20.08 in Pasadena. In Pasadena, the San Gabriel Mountains squeeze more rain out of every storm. The mechanism is covered in how LA's mountains shape its weather. In 2025-26, LAX finished near 14.2 inches while Woodland Hills logged 24.45.
Individual storms are also very uneven. In the February 2024 atmospheric river, the UCLA gauge caught 12.49 inches in five days, including 10.40 on February 5 alone, while LAX, about nine miles away, got 5.68. For a number closer to your own street, LA County Public Works runs a far denser network of gauges than the handful of NWS climate stations.
Where Can You Check LA Rain Totals During a Storm?
During a storm, the National Weather Service Los Angeles office posts rolling totals for LA County gauges over periods from one hour to five days. Its daily climate reports show the season to date and the departure from normal. LA County Public Works maps its own gauges in near real time.
Rain totals are not a safety tool, though. Flooding and debris flows depend on how fast rain falls and where burn scars sit, not on season totals. Follow NWS flood watches and warnings and local evacuation orders, and read why LA floods so fast before the first big storm.
The 14.25-inch normal is a useful benchmark, but Los Angeles gets a year close to it only about one time in seven. Most years fall well short of it or far past it, as the last four seasons show. Before the next storm, check rain timing and expected totals for Downtown and nearby neighborhoods on our Los Angeles forecast pages, then compare the NWS storm-total report afterward to see how much fell in your part of the basin.