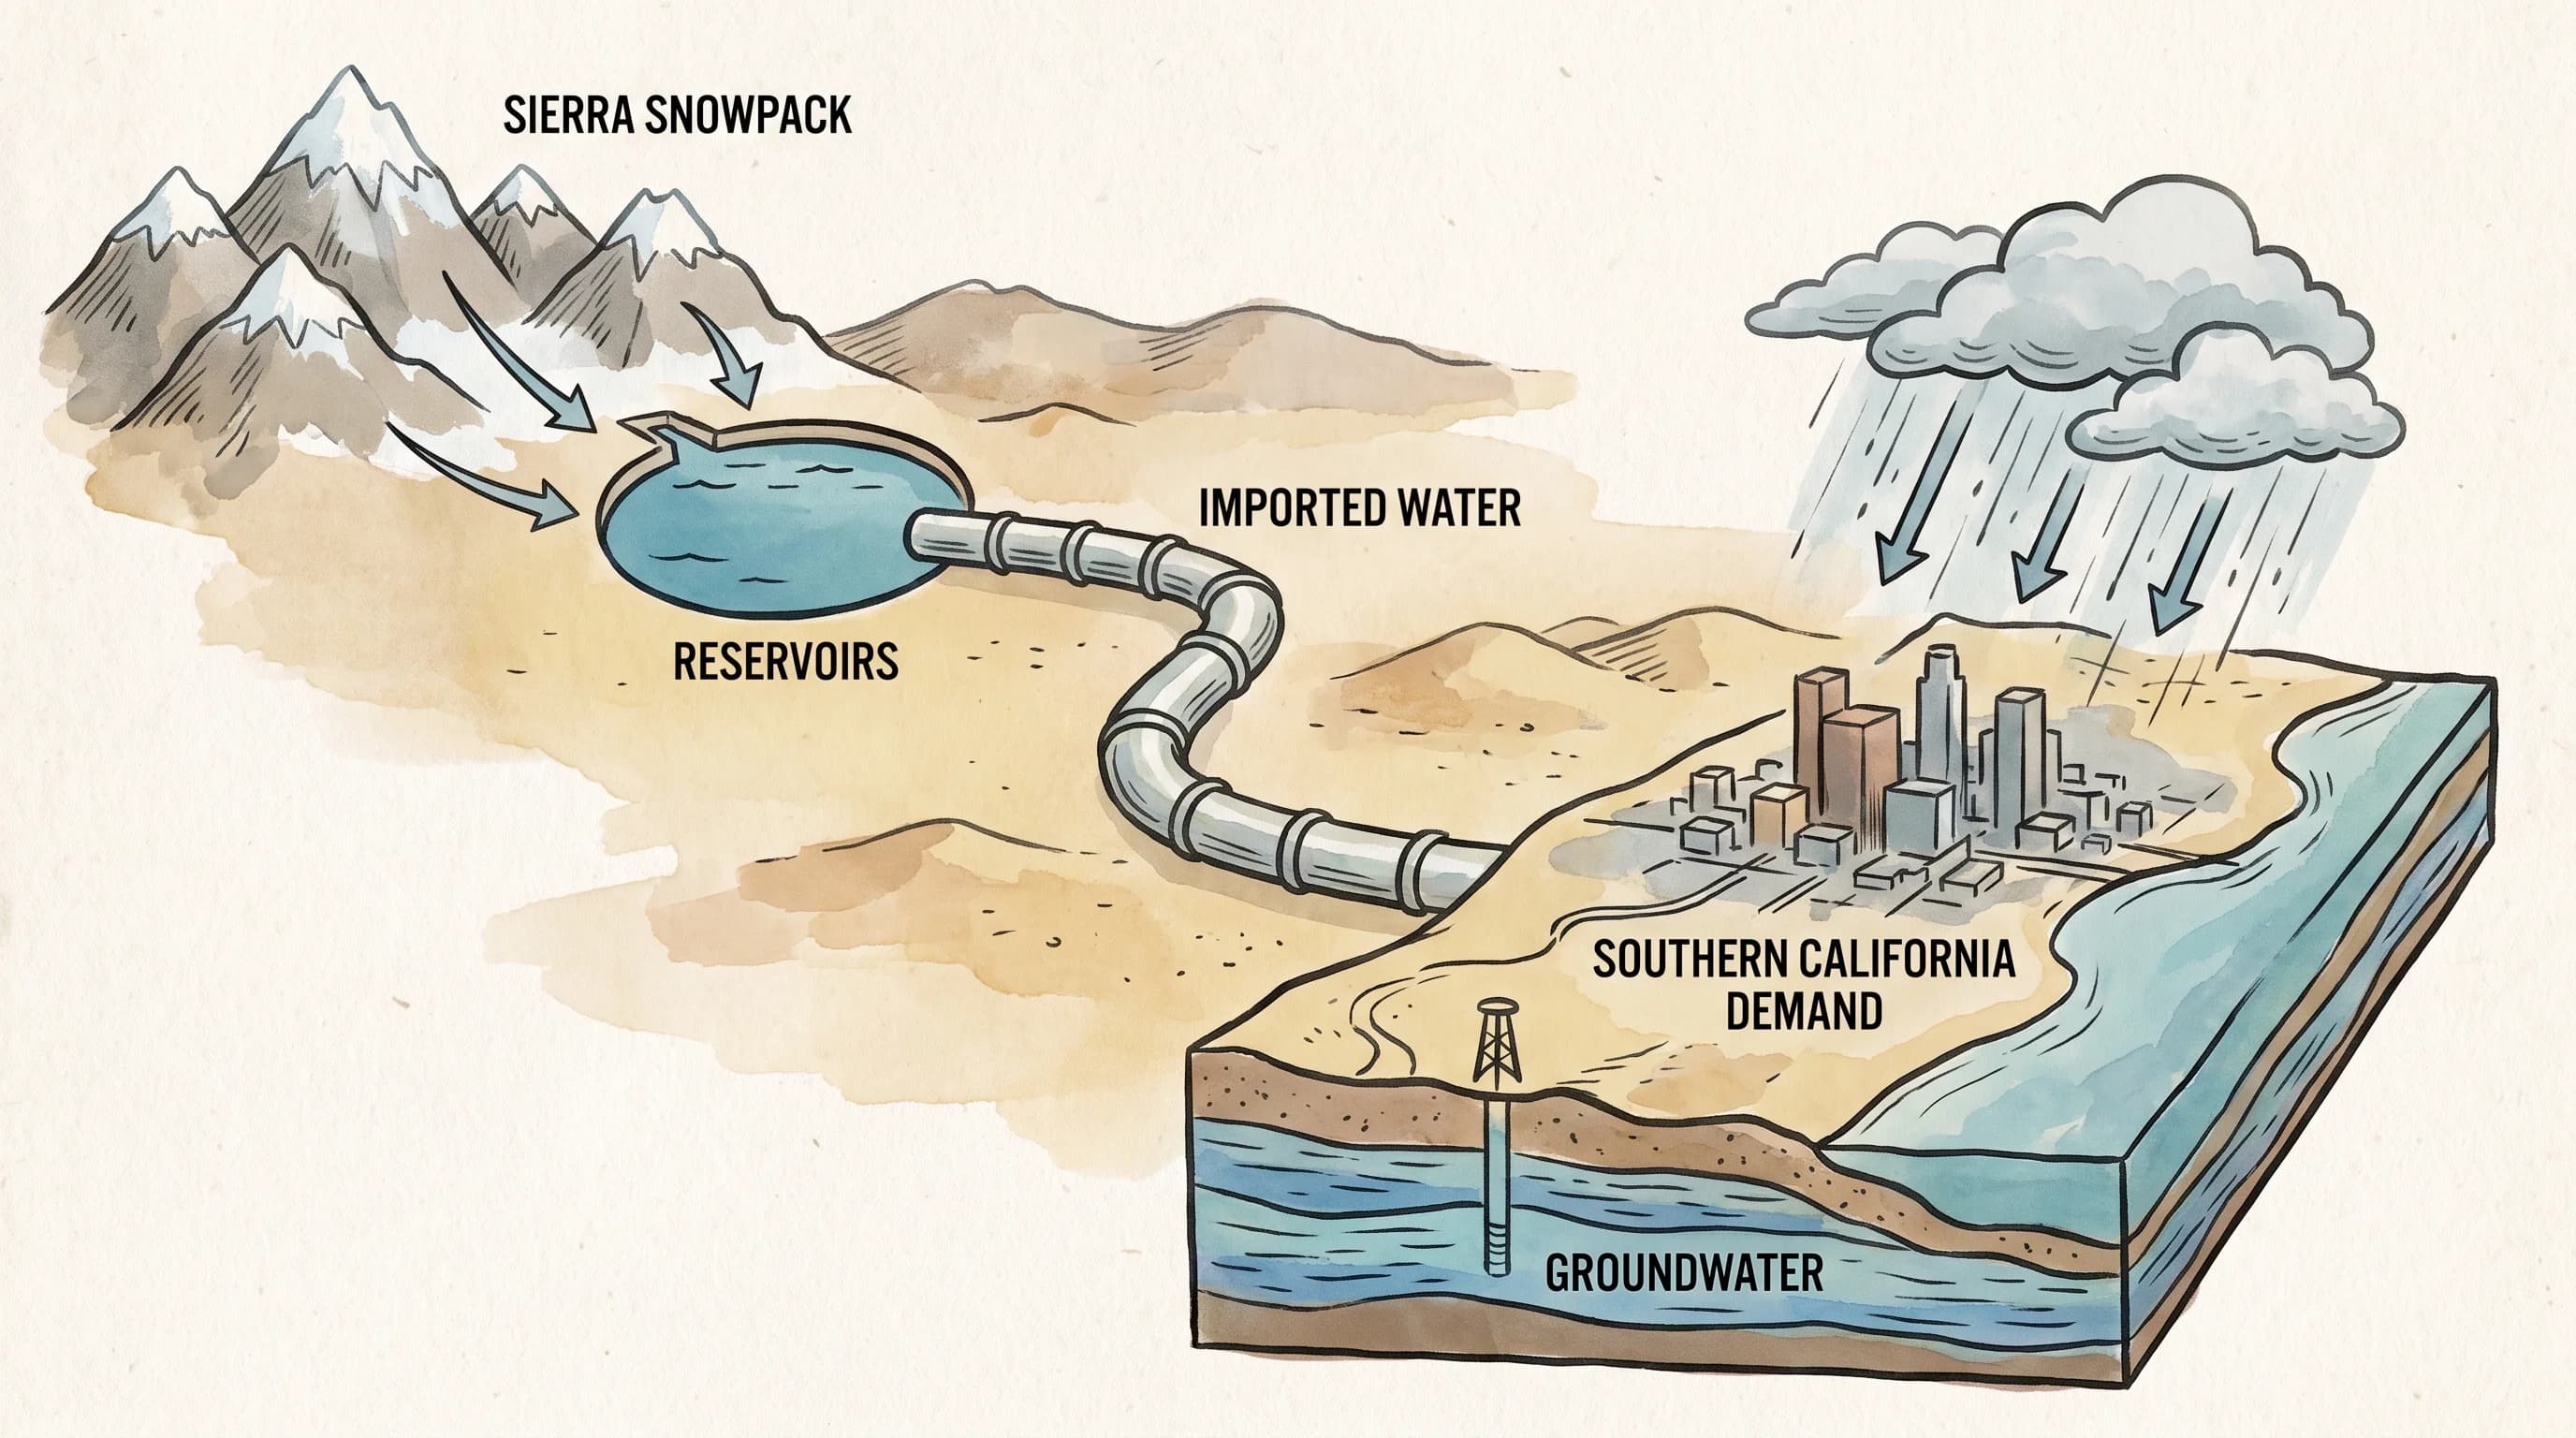
Southern California runs short of water because it gets almost all its rain in a short winter season and imports most of its water from the Sierra Nevada and the Colorado River, hundreds of miles away. Drought here is more than a dry spell. Drought happens when that long, imported supply system meets one below-normal year, or several in a row.
What Counts as Drought in Southern California?
Drought in Southern California is a long-lasting shortfall in precipitation and water supply compared with what a place and its water systems normally need. It is not the region's usual dry summer. Los Angeles and San Diego get almost no rain from about May through September in a normal year, and that seasonal dryness is the baseline climate. Drought means the wet season itself, or several wet seasons in a row, fell well short.
Scientists divide drought into four types. Meteorological drought is a rainfall shortfall compared with the long-term average. Hydrological drought follows when that shortfall lowers streams, reservoirs and groundwater.
Agricultural drought is dry soil that stresses crops and wild vegetation. Ecological drought is wider stress on natural systems, from stream habitat to forests. The four do not start or end together. One wet month can ease a rainfall deficit while slower-recovering reservoirs and groundwater stay low for months or years.
Why Does Southern California Swing Between Wet and Dry Years?
Southern California swings between wet and dry years because nearly all its rain falls in a short cool season, roughly November through March, under a Mediterranean climate. The water supply depends on that short window. A handful of atmospheric river storms, long plumes of Pacific moisture, can supply a large share of a year's rain. Missing two or three of them can leave a season well below normal without any record-dry month.
Ocean-atmosphere patterns shift the odds further. El Niño and La Niña, tracked by the NOAA Climate Prediction Center, move the Pacific storm track north or south from one winter to the next.
Southern California's wettest and driest years often line up with opposite phases, though no phase guarantees an outcome. Rising temperatures also increase evaporation from soil and reservoirs. Dry years add up quickly, and the region needs regular wet years just to keep pace with demand.
Where Does Southern California's Water Actually Come From?
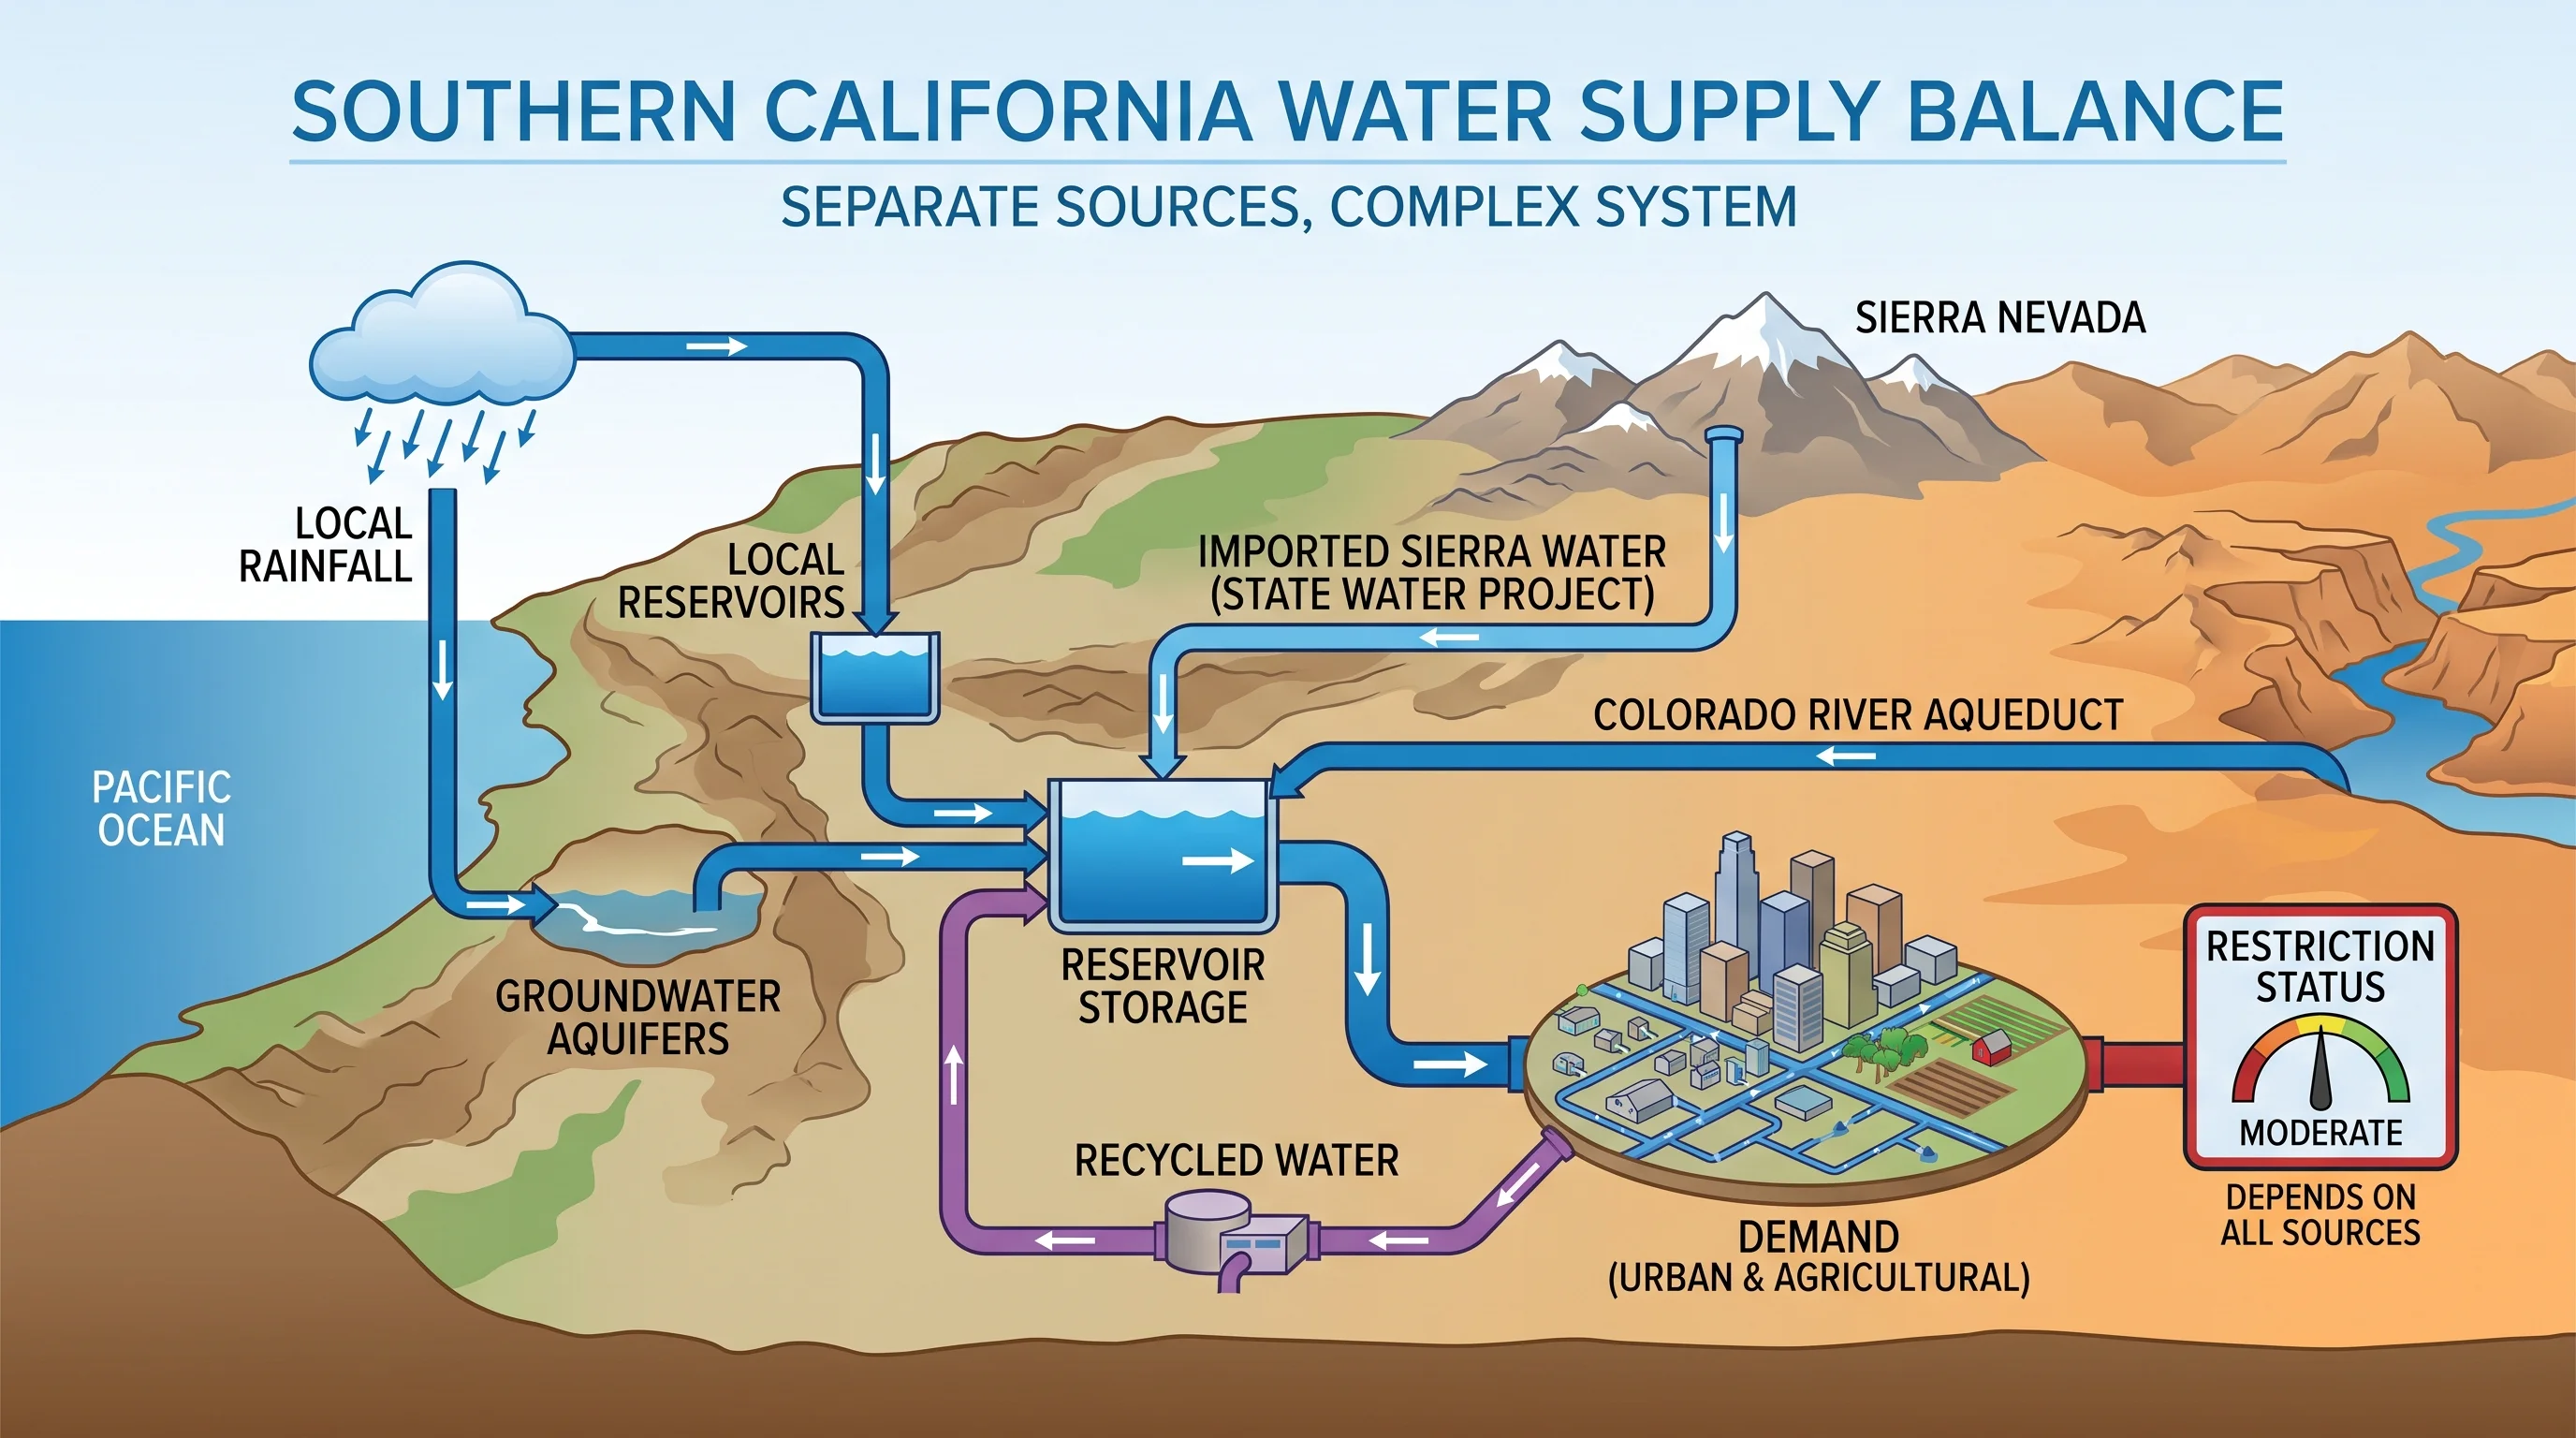
Southern California's water comes from several sources, and no single one covers demand. That is why the region's drought risk is built into its supply system, not just a matter of local rain.
Local rain and groundwater supply part of the water. A large share is imported from distant watersheds the region does not control. The table below lists the major sources, where each comes from and how exposed each is to drought. Capturing rain at home is legal in California; see California rainwater collection rules.
| Source | Typical role | Drought vulnerability |
|---|---|---|
| Local groundwater basins | Baseline supply, especially in dry years when imports tighten | High over time; aquifers pumped down during dry years take multiple wet winters to recharge |
| State Water Project (Sierra Nevada) | Imported water conveyed south from Northern California snowpack and reservoirs | High; allocations are cut in low-snowpack years and during statewide dry stretches |
| Colorado River Aqueduct | Imported water from the Colorado River basin, delivered by the Metropolitan Water District | High; tied to a separate multi-state basin under its own long-running strain |
| Local reservoirs | Short-term storage and delivery buffer | Moderate; can refill in a single strong wet season but drain quickly in consecutive dry years |
| Recycled and conserved water | Growing share of supply in many local service areas | Low; largely insulated from rainfall, though it still depends on demand and infrastructure investment |
The sources draw on separate watersheds, so a shortfall in one does not hit the others at the same time. A dry winter in the Los Angeles Basin can coincide with a healthy Sierra snowpack that keeps State Water Project deliveries steady. Local rain can look normal while a weak Colorado River Basin snowpack forces cutbacks. The California Department of Water Resources tracks each source separately for this reason.
How Do Heat and Snowpack Deepen a Drought?
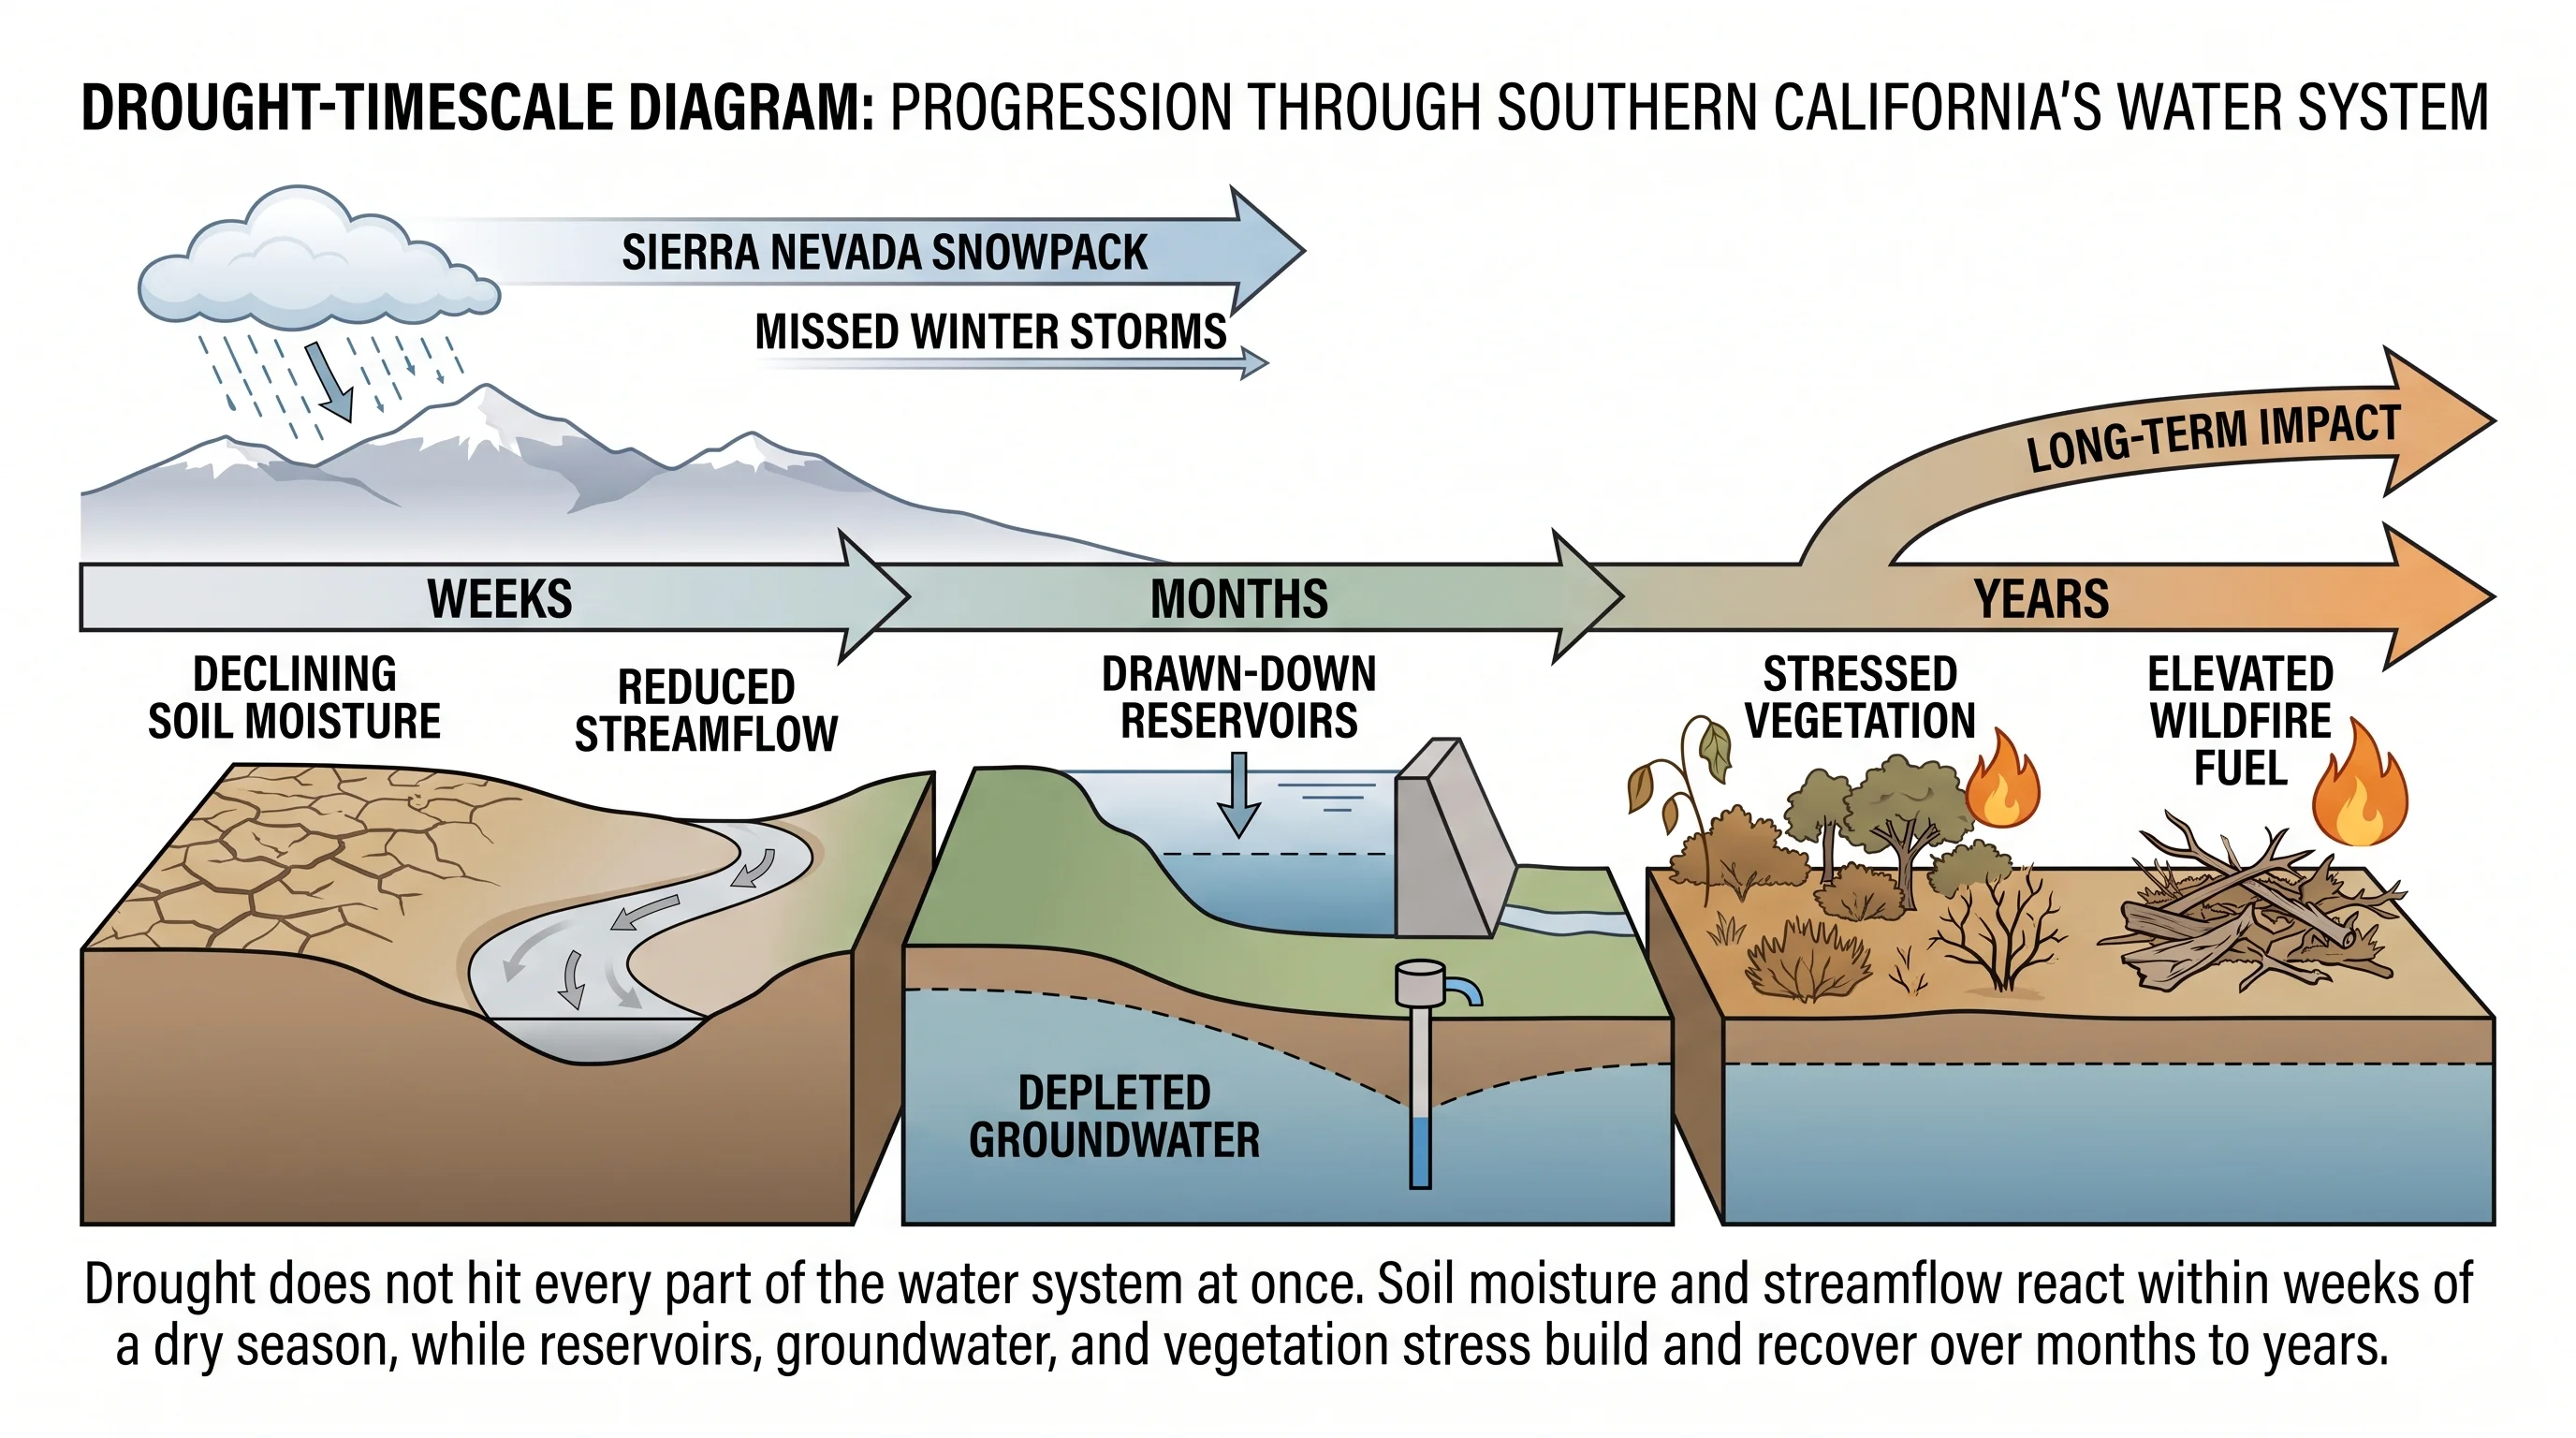
Heat deepens a drought by pulling more moisture from soil, reservoirs and plants through evaporation. A hot year can worsen drought even without a matching drop in rain. A warm dry year and a cool dry year with similar rainfall therefore have different effects on the ground.
Sierra Nevada snowpack is Southern California's largest natural reservoir. Winter snow melts gradually through spring and summer, feeding streams and reservoirs when California gets little or no rain.
A below-normal snow year, or a normal one that melts early in a warm spring, sends water downstream before reservoirs and irrigation systems can capture and use it. Less water is left for late summer, when demand peaks. The effect resembles a rainfall deficit, even though the storms were not unusually dry.
Dry soil and stressed plants also raise fire risk, and drought years often overlap with dry, windy fire weather. For the desert side of dry, windy weather, see dust storms and desert weather in Southern California.
How Is Drought Different From Desertification or a Water Shortage?
Drought is temporary and recurring; a later wet cycle can largely reverse it, though groundwater and ecosystems take longer to recover. Desertification is a longer-term loss of land productivity, often from soil loss, erosion or land use, that one good winter does not end. Southern California's semi-arid climate exposes its edges to desertification pressure, but the two terms describe different processes on different timescales.
A water shortage is declared by a water agency, such as the Metropolitan Water District of Southern California or a city water department, based on that agency's contracted supply, storage and demand. Shortage stages and restrictions can stay in effect after a drought classification improves, because contracts and infrastructure do not reset when a map changes color. An agency with strong local storage can also avoid restrictions during a regional dry spell.
For current conditions, see how to actually check if California is in a drought right now, which explains how to read the Drought Monitor, snowpack and reservoir data.
How Should You Read a Drought Map?
A drought map is a snapshot, not a permanent verdict. To read one, check four things: the category scale, the update date, the geographic scale and whether the map shows modeled conditions or direct observations.
The U.S. Drought Monitor updates weekly using precipitation, soil moisture, streamflow and satellite vegetation data. Its categories run from Abnormally Dry through Exceptional Drought. It updates every Thursday, so a map viewed on a Tuesday may miss a storm that just passed.
A drought map shows precipitation-related deficits, not water supply. Pair it with the California Department of Water Resources reservoir and snowpack dashboards and your local water supplier's conditions page before judging water availability. The NWS Los Angeles/Oxnard and NWS San Diego offices and NOAA Climate.gov explain the storms and seasonal outlooks behind the map. The map remains the official source for current drought classification.
Southern California's microclimates split rainfall totals sharply between the coast, basin and mountains, so a countywide or statewide drought category can hide local differences. That variability, explained in why Los Angeles has so many microclimates, is another reason to check dated, local data. The same heat and inversions that deepen dry-season stress also trap pollution, as why Los Angeles is so smoggy explains.
Southern California drought works the same way every year: a short, storm-dependent wet season feeds a water system that stretches across the Sierra Nevada, the Colorado River basin and slow-recovering local groundwater. Only dated sources show the current status. Before a decision that depends on drought, from a hike near Woodland Hills to dry-season heat in Pasadena or Downtown Los Angeles, compare the Drought Monitor map, snowpack, reservoirs, Colorado River conditions and your local supplier's current status.