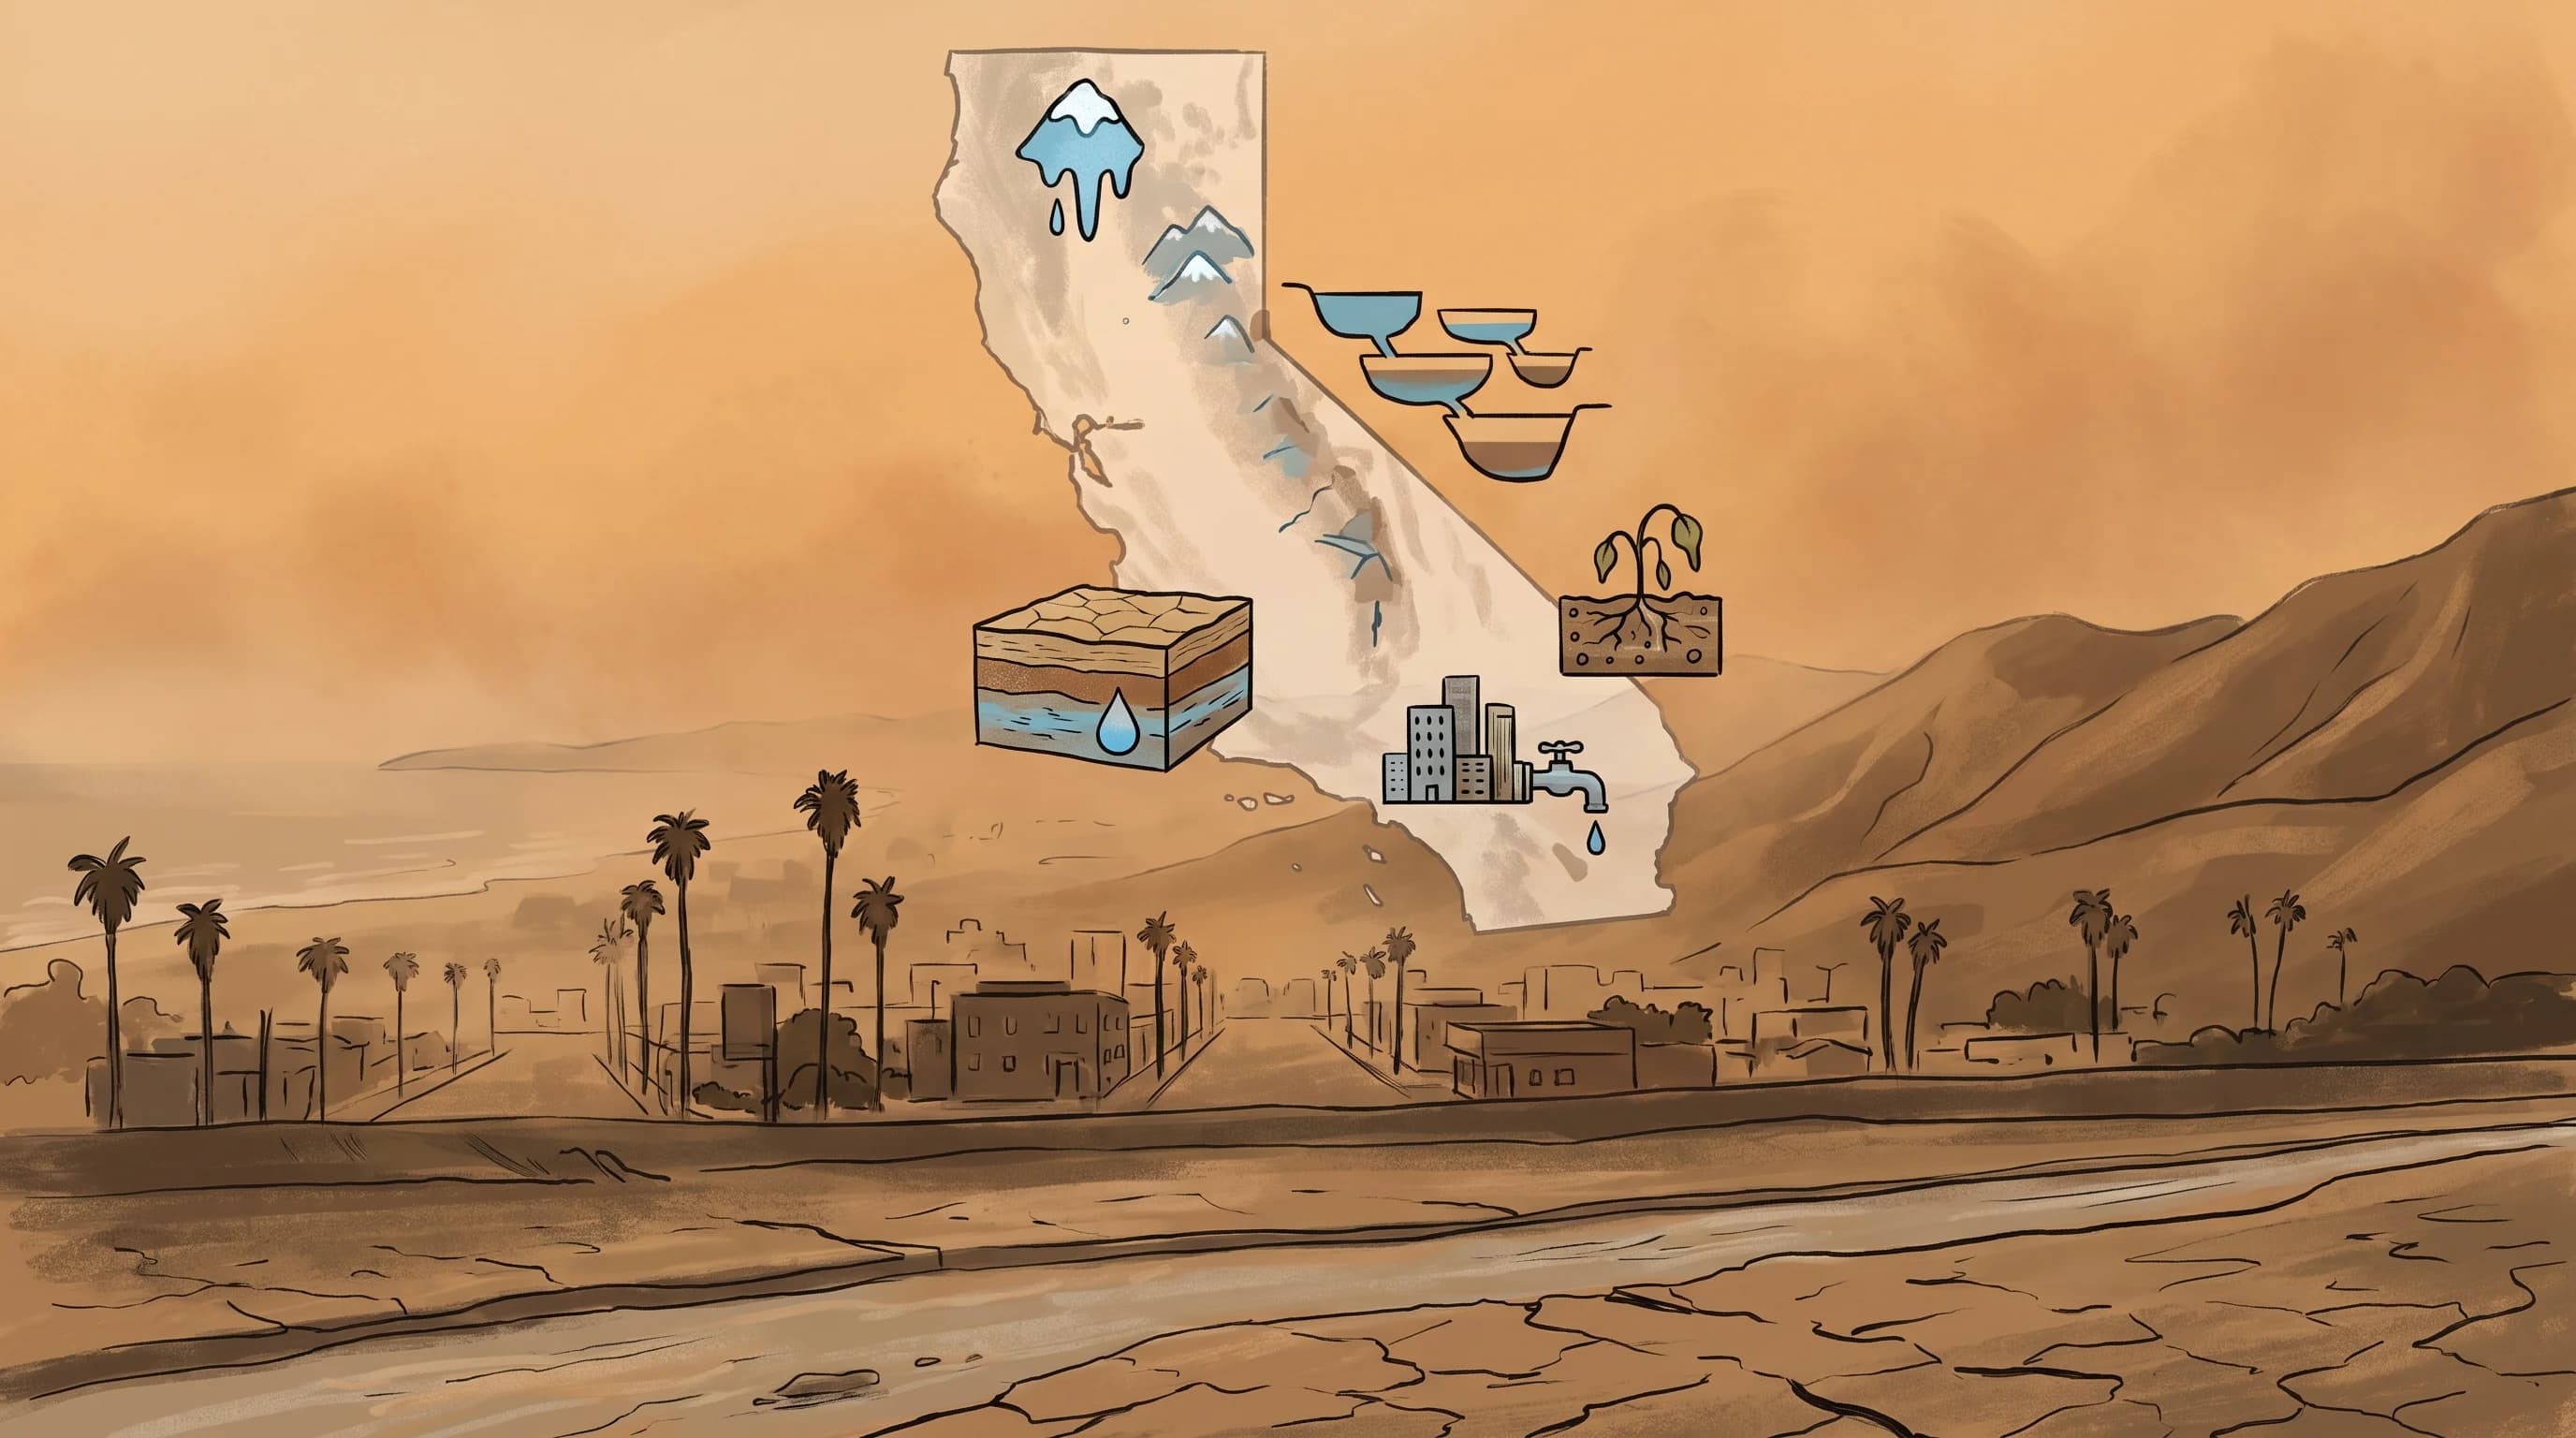
California is partly in drought, and Los Angeles County is not. On the U.S. Drought Monitor map released September 24, 2026, about 23% of California was in Moderate Drought (D1), none was in Severe Drought or worse, and about 70% was at least Abnormally Dry (D0).
Los Angeles County had no drought at all, with only about 3% of the county Abnormally Dry. The status changes weekly, so check the current U.S. Drought Monitor map for California and the snowpack and reservoir dashboards from the California Department of Water Resources for today's reading.
Is California Currently in a Drought?
California is currently in a mild, partial drought. The September 24, 2026 U.S. Drought Monitor map, with data valid September 22, placed 23.3% of the state in Moderate Drought (D1) and 0% in Severe (D2), Extreme (D3) or Exceptional (D4) Drought.
Another 46.5% was Abnormally Dry (D0), a warning category below drought, and 30.2% had no classification. The Drought Monitor is a joint product of the National Drought Mitigation Center, NOAA and the USDA, and it releases a new California map every Thursday. The map can change noticeably after one wet or dry month.
Los Angeles County was drought-free on the same map, with 97.3% unclassified and 2.7% Abnormally Dry. The Los Angeles Basin, the Sierra Nevada and the Colorado River basin that supplies part of the region's water can carry different classifications at the same time. The National Weather Service offices for the region, NWS Los Angeles/Oxnard and NWS San Diego, publish local rainfall totals compared with seasonal averages, which is a useful check on any statewide headline.
| Category | Label | General description |
|---|---|---|
| D0 | Abnormally Dry | Short-term dryness slowing planting or growth; some lingering water deficits |
| D1 | Moderate Drought | Some damage to crops or pastures; streams, reservoirs, or wells getting low; voluntary water-use restrictions requested |
| D2 | Severe Drought | Crop or pasture losses likely; water shortages common; water restrictions imposed |
| D3 | Extreme Drought | Major crop and pasture losses; widespread water shortages or restrictions |
| D4 | Exceptional Drought | Exceptional and widespread crop and pasture losses; shortages of water in reservoirs, streams, and wells creating water emergencies |
The National Drought Mitigation Center, NOAA and the USDA maintain the D0-D4 scale above, and every California drought map uses it. The scale stays the same from year to year; only the colors on California change.
Who Decides Where Drought Exists?
The U.S. Drought Monitor decides where drought exists, and it combines many measurements instead of relying on one. Each week, authors from the National Drought Mitigation Center, NOAA and the USDA blend precipitation compared with normal, the Standardized Precipitation Index, soil moisture models, streamflow, satellite vegetation health, reservoir storage and reports from state and local observers into one map. The map can improve after a strong storm cycle even when slower indicators, like groundwater, have not recovered.
The California Department of Water Resources tracks the state's water supply separately, including storage at reservoirs such as Lake Oroville and Shasta Lake, the Sierra Nevada snowpack that refills them each spring and State Water Project allocations. Water suppliers, from the Los Angeles Department of Water and Power to small city districts, decide on their own whether to declare shortage stages or restrictions such as watering schedules. A Drought Monitor category is not a legal mandate. State and local agencies use it alongside their own supply data.
Why Can a Wet Winter Fail to End Every Drought Impact?
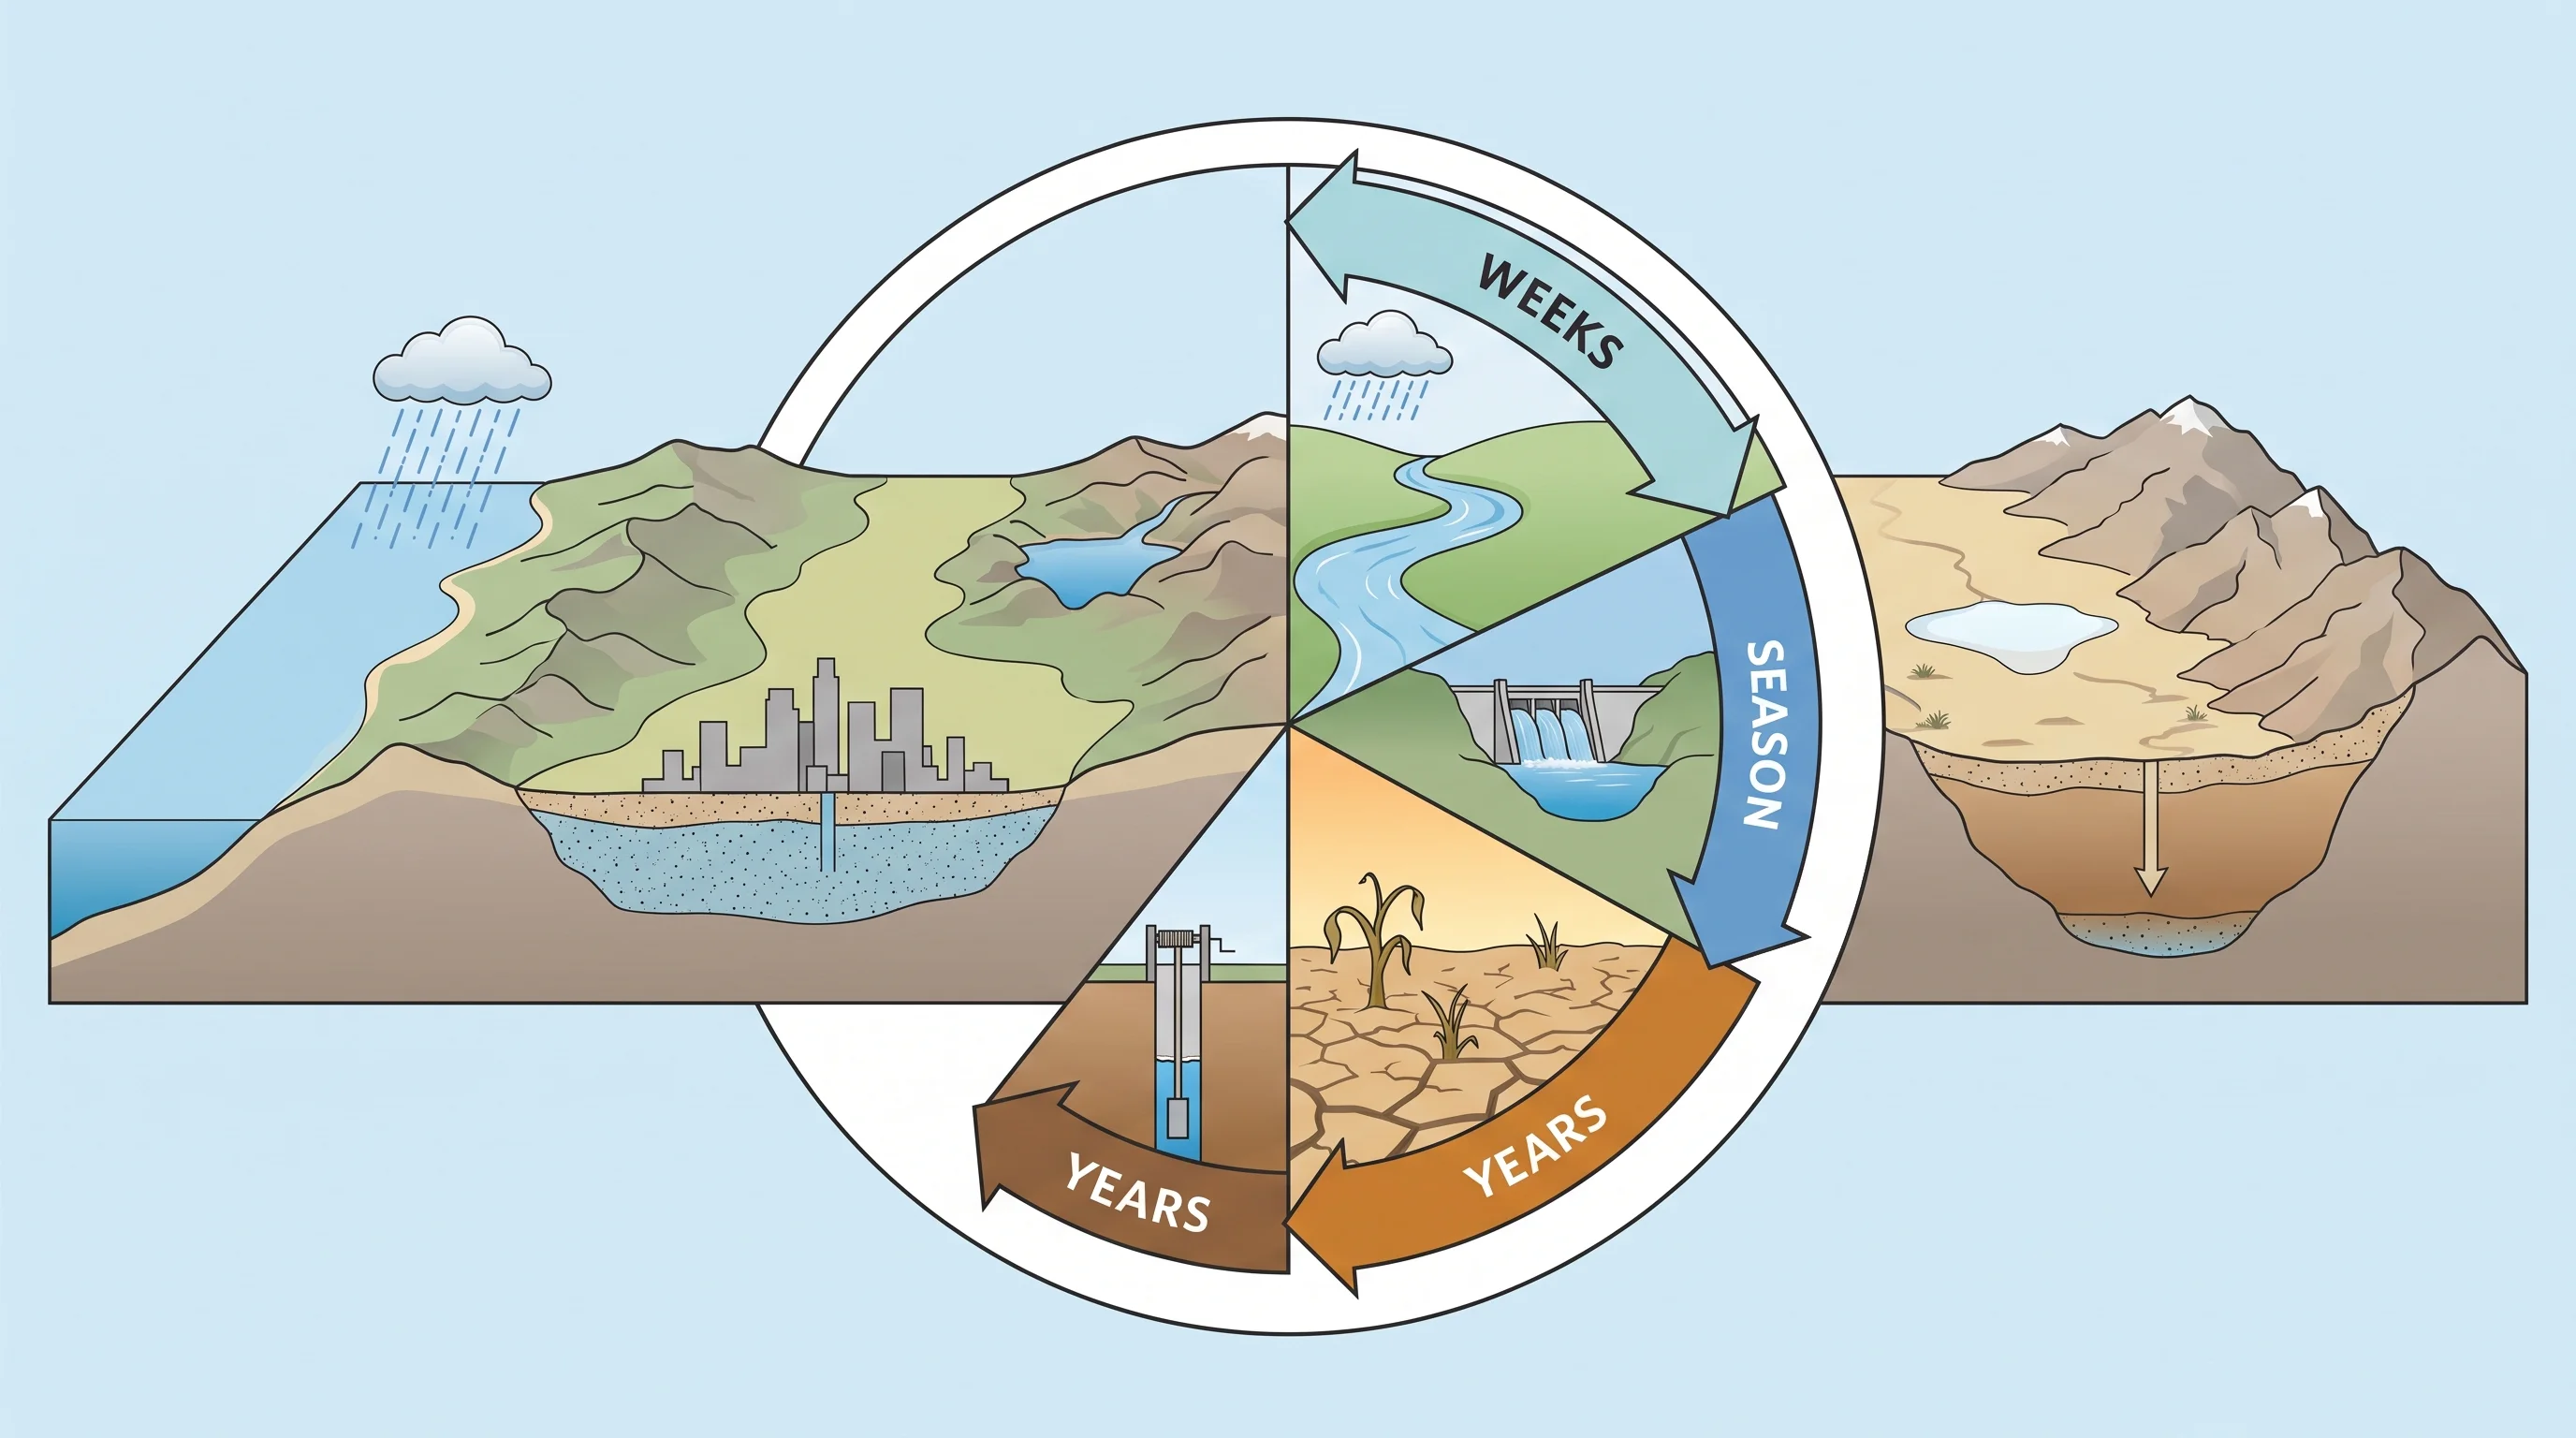
One wet winter cannot end every drought impact because each impact recovers on its own timeline. Streamflow and topsoil moisture rebound within weeks of heavy rain.
Reservoirs usually recover in one strong wet season, because they fill as water flows in. Groundwater recovers slowest. Aquifers pumped down in dry years, especially in the Central Valley's farm regions, can take several wet years or more to recharge, because water must seep slowly down through soil and rock.
Ecosystem damage lasts even longer. Trees weakened by years of water stress stay more vulnerable to bark beetles and wildfire after the rain returns.
The reverse is also true. One very wet winter, especially one with a string of atmospheric rivers hitting the Sierra Nevada and Southern California, can move the Drought Monitor map from severe categories toward drought-free for surface water and reservoirs. State hydrologists may still report groundwater basins in overdraft. Reading only the map's color without checking which indicators improved is the most common way people misread California's water situation.
How Can Southern California Differ From the State Map?
Southern California's water status can differ from the state map because the region depends more on imported water than on local rain. Much of the water used in Downtown Los Angeles, Pasadena and Woodland Hills comes through the State Water Project from the Sacramento-San Joaquin Delta, the Colorado River Aqueduct and the Los Angeles Aqueduct from the Eastern Sierra. The Metropolitan Water District of Southern California and other agencies blend and deliver it. Southern California's supply therefore depends on Sierra snowpack, Colorado River storage at Lake Mead and Lake Powell and local rain, and those three do not always move together.
A dry year in the Colorado River basin, which has been in a long drought tied to the wider Southwest megadrought, can strain Southern California supply even when the Los Angeles Basin has a wet year. A strong local rain year, like the 19.73 inches Downtown Los Angeles recorded in 2025-26, does not refill Lake Mead. The Sierra snowpack percentage quoted in most news coverage misses part of what drives Southern California's supply. A Southern California supplier's own water supply page shows the full blended picture.
What Is the Difference Between Drought and a Water Shortage?
Drought is a shortage of precipitation or water in nature; a water shortage is a supply problem declared by a water agency. Meteorological drought is a precipitation deficit compared with normal for a place and period, regardless of how much water people use. Hydrological drought follows when that deficit lowers streamflow, reservoirs and groundwater. A water shortage is declared by a water agency based on supply, demand, contracted allocations and infrastructure.
A region can sit in a Drought Monitor category while its supplier reports enough water. A supplier can also tighten restrictions with no drought classification, for example when a treatment plant is offline or a legal allocation is cut.
For how meteorological drought becomes hydrological drought and how California's reservoirs and groundwater buffer dry years, see why Southern California runs out of water even when it rains.
Which Current Sources Answer the Question?
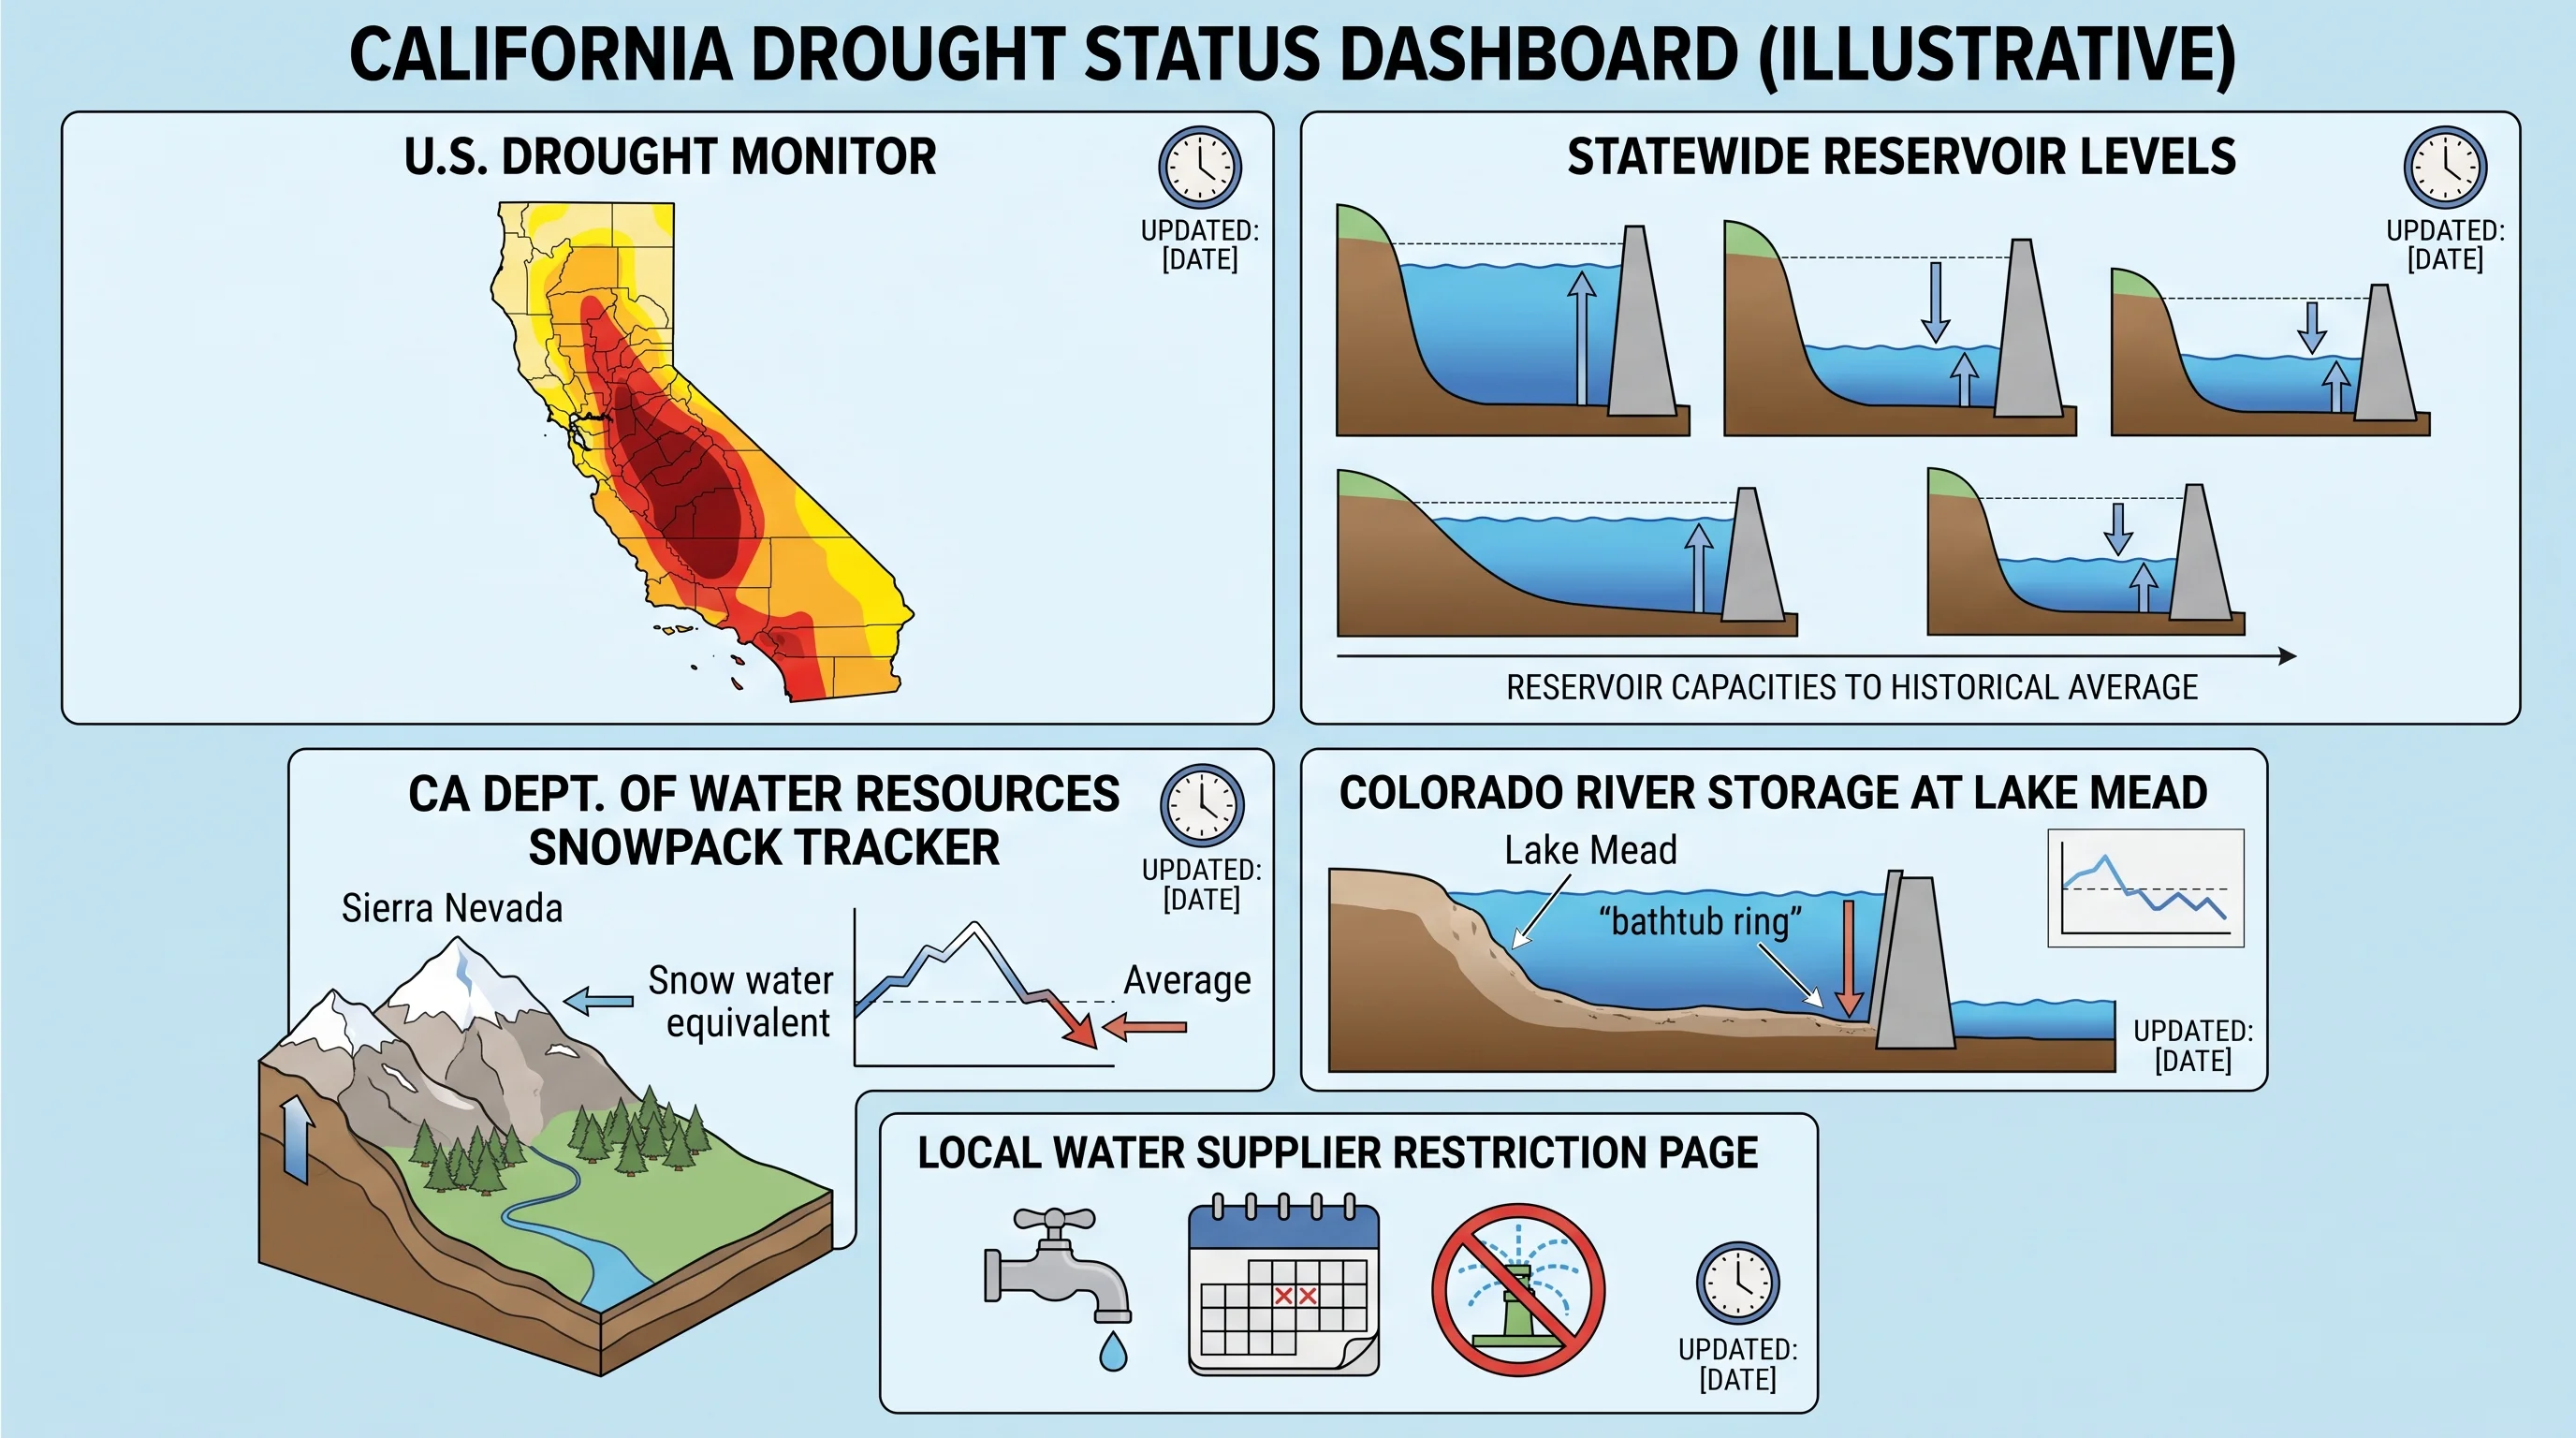
Five sources, checked together, show California's current drought status. Start with the U.S. Drought Monitor's California map, updated every Thursday, for the official classification by county. Then check the California Department of Water Resources drought conditions page, which links live snowpack and statewide reservoir storage. For local rainfall compared with normal, check NWS Los Angeles/Oxnard or NWS San Diego.
Check the NOAA Climate Prediction Center for seasonal outlooks on whether wet or dry weather will continue, and NOAA Climate.gov for plain-language context, including whether El Niño or La Niña is active. Finally, check your own water supplier's website, because shortage stages and restrictions are set locally and may not match the Drought Monitor color for your county.
Every drought status claim should carry the date it was checked. If you see a drought percentage or classification with no date, treat it as unverified and go to the primary source.
What Do People Get Wrong About Whether California Is Still in Drought?
The most common mistake about California drought is treating one wet or dry season as a permanent condition. California's precipitation swings between very wet and very dry years more sharply than almost any other state, according to NOAA Climate.gov and state climatologists.
A handful of atmospheric river storms supply much of each winter's precipitation. Missing a couple of those storms can push the state toward drought within one season. An unusually active stretch can refill reservoirs, or even force them to release water, within weeks.
The second mistake is assuming a full reservoir means no drought, or an empty one means statewide crisis. Reservoir levels are one input among several and vary from reservoir to reservoir. A full Northern California reservoir says little about groundwater in the San Joaquin Valley or pressure on the Colorado River, which supplies part of Southern California. Check the current indicators above instead of judging from one memorable storm season.
California's drought status changes weekly with the Drought Monitor map, seasonally with the snowpack and over years with reservoirs and aquifers. Before repeating "still in drought" or "drought is over," check the dated U.S. Drought Monitor map, the California DWR snowpack and reservoir dashboards and your local supplier's restrictions page. Our California snowpack guide explains the snowpack indicator, and the guide to collecting rainwater in California covers one household-scale response.