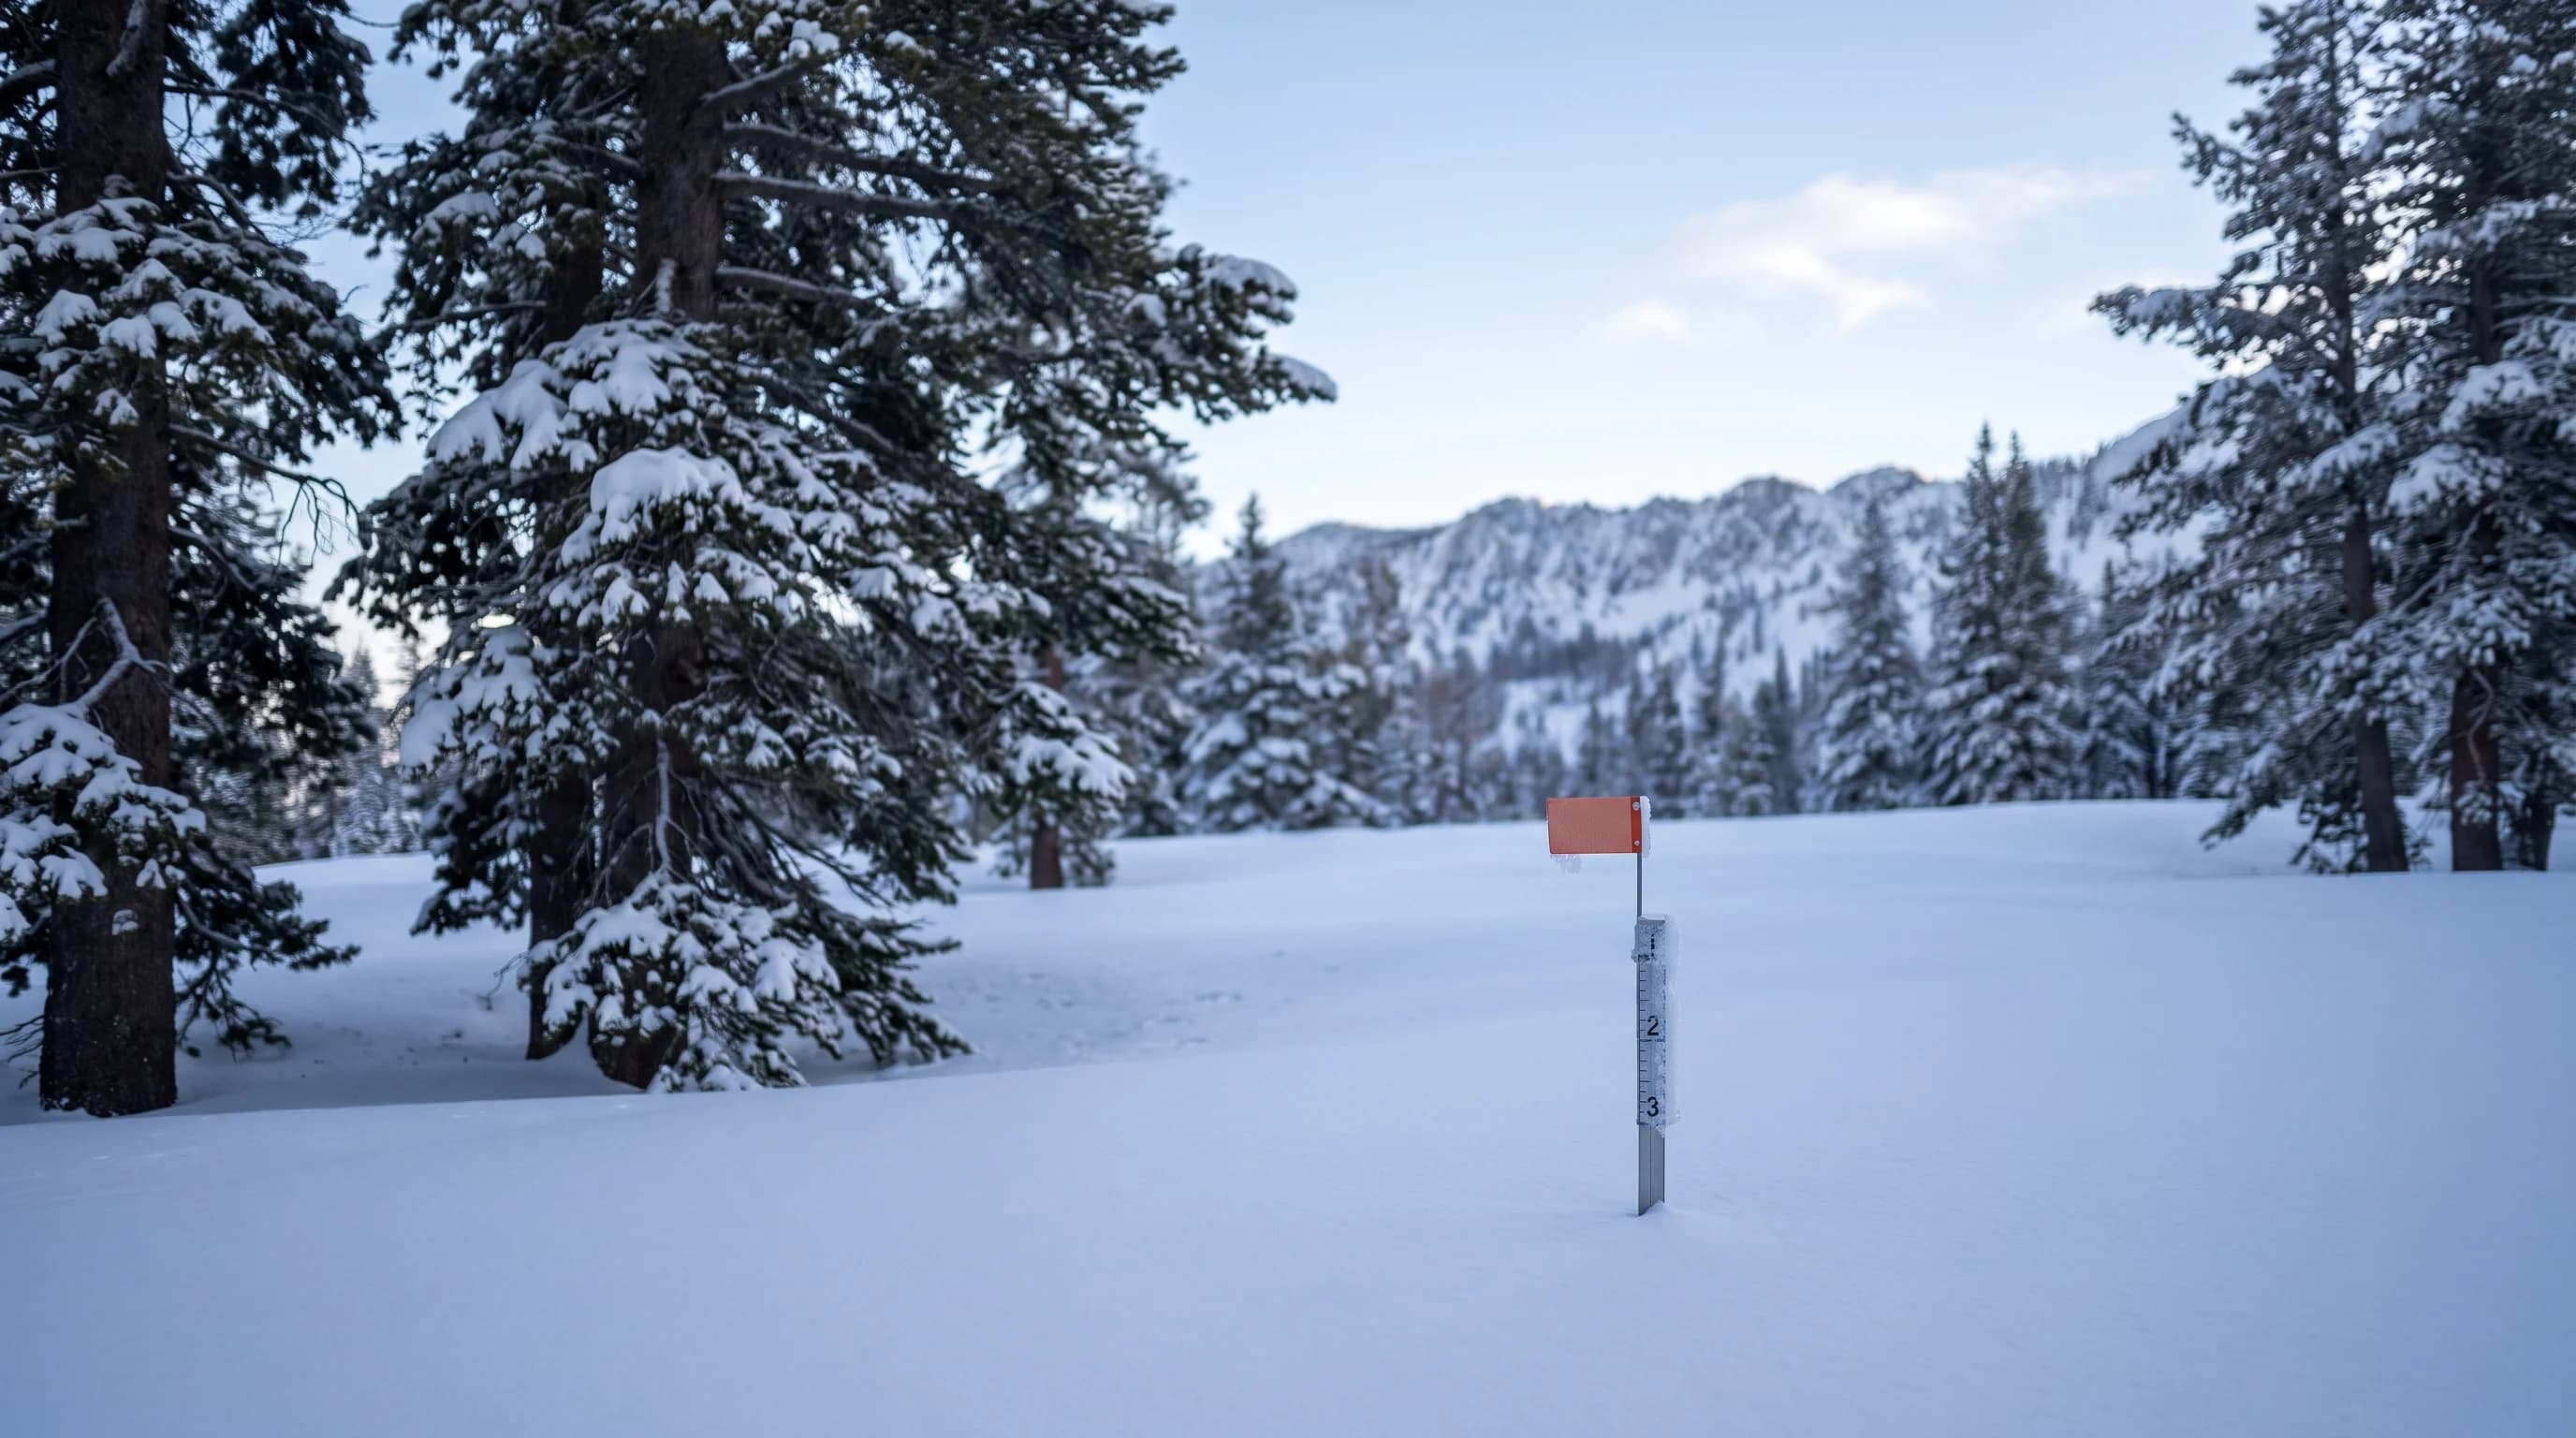
California's snowpack is mountain snow that stores winter precipitation as ice and releases it as water in spring and summer. Most of it builds in the Sierra Nevada, with a smaller share in Southern California's mountains.
Water agencies measure snowpack as snow-water equivalent, not snow depth. Melt timing matters almost as much as the total, because fast or early melt raises flood risk and leaves less water for summer. For Los Angeles, Pasadena and the rest of Southern California, Sierra snowpack is one water source among several.
What Is California's Snowpack?
California's snowpack is the layer of mountain snow that builds up over a winter and works as natural water storage. Snow at high elevation does not run off right away the way rain does. The snow stays frozen on the mountainside, sometimes for months, and releases water gradually as temperatures rise. That slow release matters because California gets most of its precipitation in a few winter months but needs water all year for cities, farms and ecosystems.
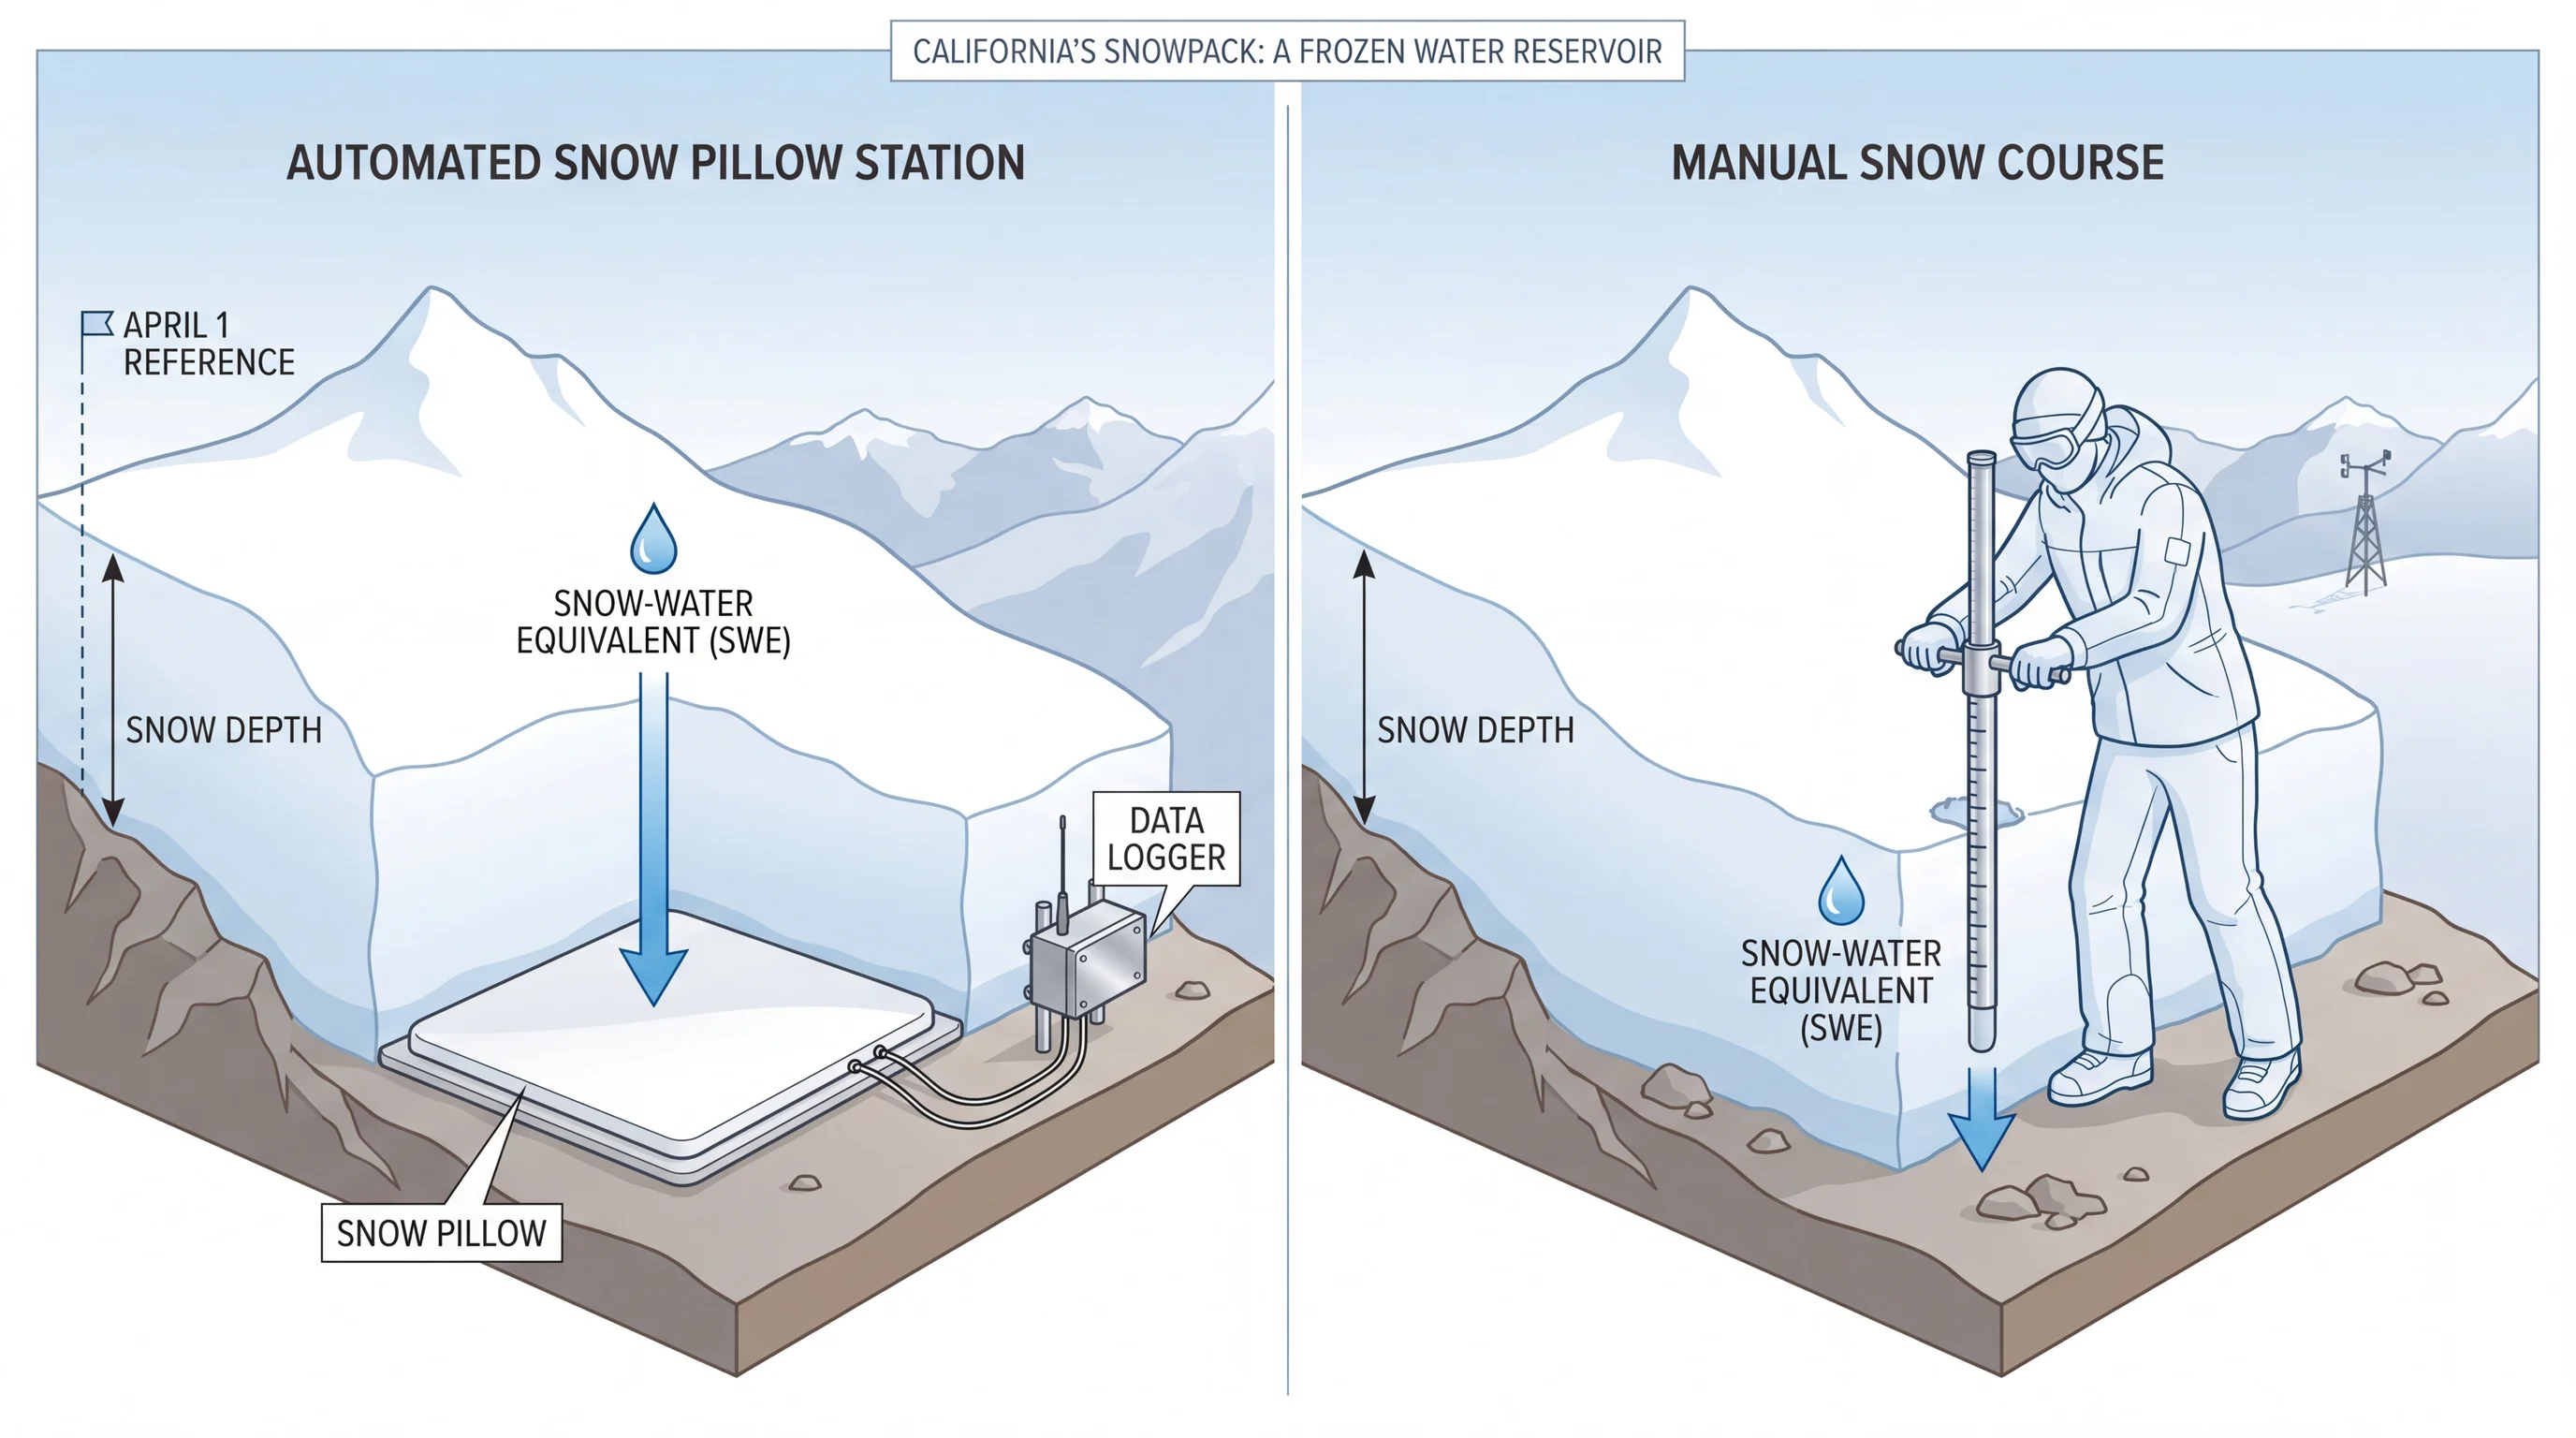
Snow-water equivalent is the depth of liquid water a snow layer would produce if it melted completely, and it is the number water planners use. Snow depth is a poor substitute. A foot of light powder from a cold, dry storm holds far less water than a foot of dense, wet snow from a warm atmospheric river. Two storms can leave the same depth of snow and very different amounts of stored water.
| Region | Approximate elevation range | Role in the water system |
|---|---|---|
| Sierra Nevada (Northern & Central) | Roughly 5,000 to over 12,000 feet | The state's dominant snowpack region; feeds major reservoirs and the State Water Project |
| Southern Sierra | Roughly 6,000 to over 13,000 feet | Feeds Central Valley reservoirs and agricultural water districts that also interact with statewide allocation decisions |
| San Bernardino Mountains (Big Bear Lake area) | Roughly 6,000 to 10,000+ feet | Local Southern California snowpack; contributes to local watersheds and groundwater recharge rather than statewide conveyance |
| San Gabriel Mountains (Wrightwood area) | Roughly 6,000 to 10,000+ feet | Local snowpack feeding Los Angeles County watersheds and spreading grounds used for groundwater recharge |
Where Does the Snowpack Accumulate, and How Is It Measured?
Most of California's water-supply snowpack builds in the Sierra Nevada, a range about 400 miles long whose elevation keeps winter storms cold enough to produce and hold deep snow. Southern California's San Bernardino Mountains around Big Bear Lake and San Gabriel Mountains around Wrightwood also collect winter snow. That local snow feeds regional watersheds, groundwater and mountain communities, but it does not supply the statewide aqueduct system. For where Southern California gets snow, see where does it snow in Southern California.
The California Department of Water Resources and its partner agencies measure snowpack two ways. Automated snow pillows at fixed mountain sites weigh the snow on top of them and convert that weight into a snow-water equivalent reading in near real time. Survey crews also visit established snow courses, usually monthly in winter, and sample depth and density with core tubes. California has used snow courses since the early 1900s, and they still serve as a check on the automated sensors.
April 1 is the benchmark date for California snowpack because the Sierra snowpack has historically reached its peak around then, before spring melt takes over. A reading from another date describes a different phase of the snow year. Do not compare it directly with an April 1 figure.
Why Does Sierra Snow Matter to Southern California?
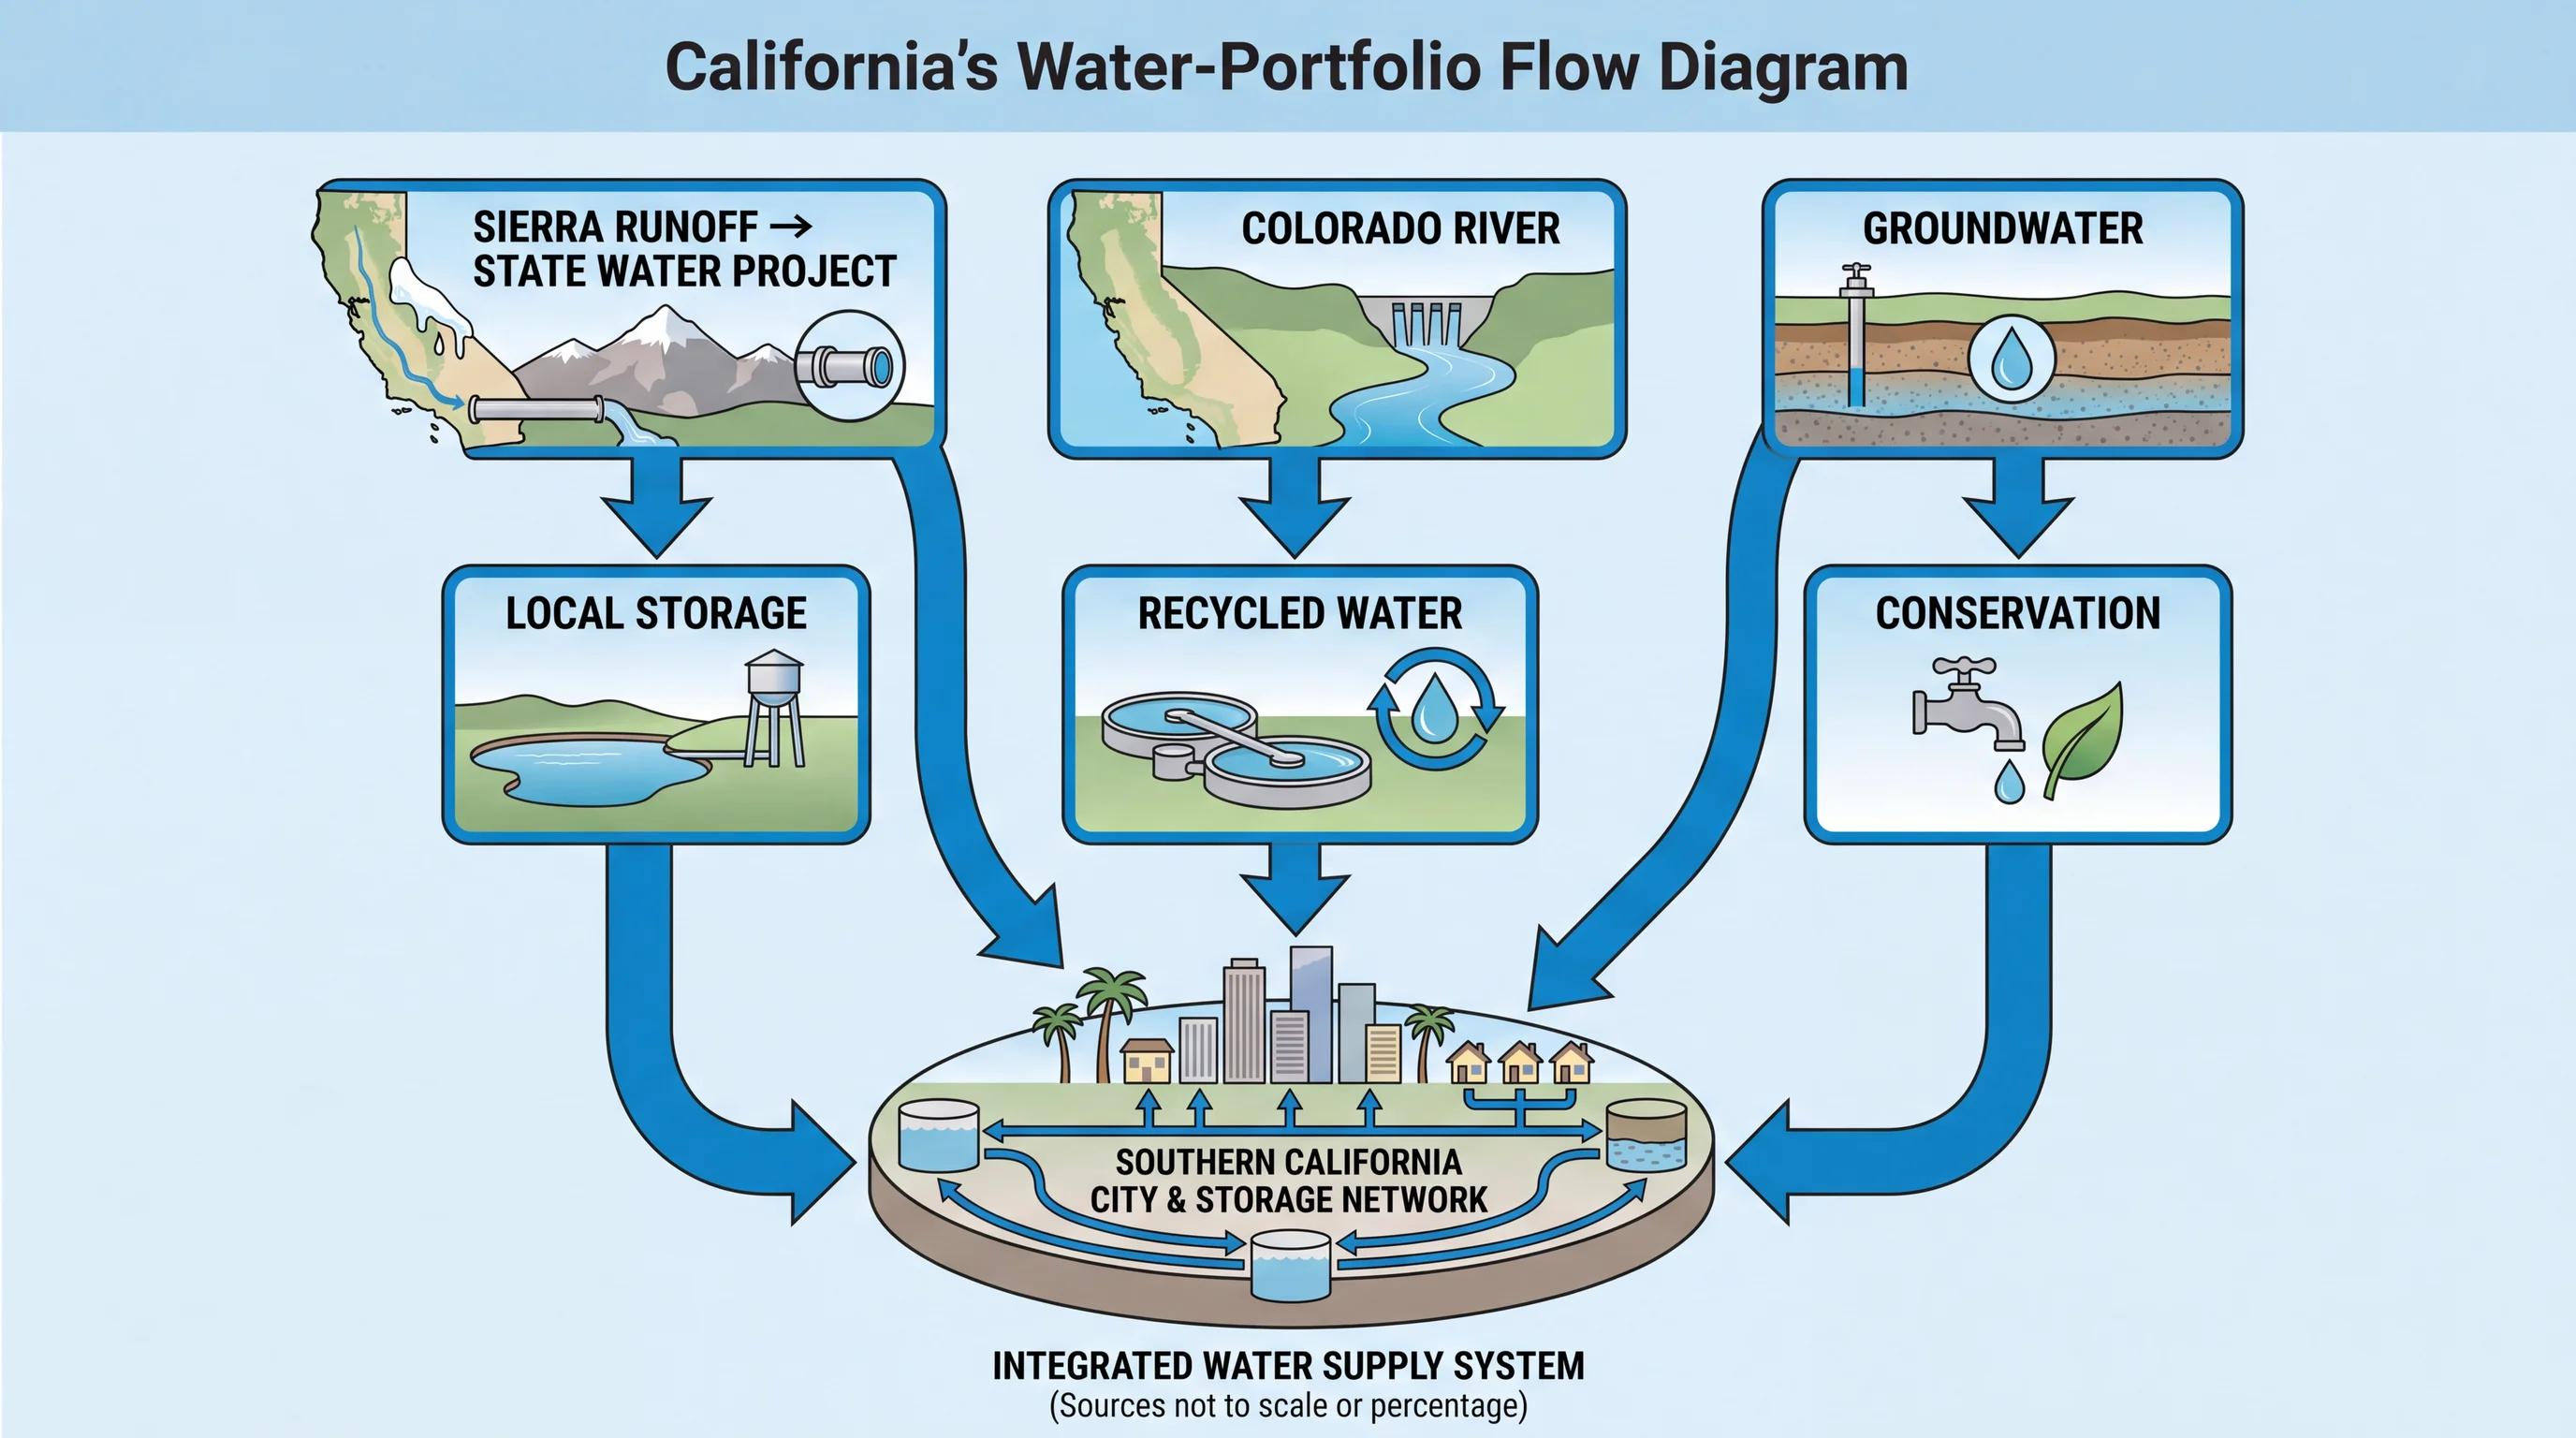
Sierra snow matters to Southern California because Sierra snowmelt feeds the State Water Project. The State Water Project's reservoirs, pumping plants and aqueducts move water from Northern California through the Central Valley and over the Tehachapi Mountains. Contracting agencies then deliver it to homes and farms across the Los Angeles Basin. The State Water Project is a major part of the region's supply, but not the only part.
Southern California also draws water from the Colorado River, local groundwater basins, regional reservoirs, conservation, recycled water and small-scale home rain capture (see California rainwater collection rules). Conservation programs have cut per-person water use substantially over recent decades. A weak Sierra snow year raises the importance of these other sources, and a strong snow year eases pressure on them. A statewide snowpack headline is one input, not a verdict on whether Southern California will have enough water.
The Metropolitan Water District of Southern California coordinates much of this supply. Metropolitan blends State Water Project deliveries, Colorado River water and stored groundwater into one regional system serving member agencies in Los Angeles, Orange, San Diego and several other counties. Each local water district decides how much to rely on imported water versus local groundwater in a given year. The Sierra snowpack outlook informs those decisions but does not dictate them.
A district with large groundwater reserves handles a weak snow year more easily than one that depends on imported water. That is why two neighboring communities can feel the same statewide snow year very differently. How supply strain shows up locally is covered in Southern California droughts explained, and current conditions are tracked in is California still in a drought.
What Makes a Snow Year Above or Below Average?
A snow year is above or below average depending on three things: where the winter storm track sets up, how many atmospheric rivers reach California and the snow level during each storm. The snow level is the elevation where rain turns to snow. The NOAA Climate Prediction Center monitors El Niño, La Niña and other patterns that shift the storm track. Neither El Niño nor La Niña guarantees a specific snowpack outcome.
A storm's temperature matters as much as its moisture. Cold storms that keep the snow level low build deep snowpack quickly. Warm atmospheric rivers can drop huge rainfall totals that fall as rain even at elevations that normally collect snow. Timing across the winter counts too: several cold storms spread from December through March build more snowpack than the same precipitation in fewer, warmer storms.
A percent-of-normal snowpack figure means something only when it names three things: the basin or statewide index, the observation date and the normal period used for comparison. The Department of Water Resources maintains those multi-decade normals. A figure missing any of the three cannot be compared with history, because it describes one moment in one winter.
Atmospheric rivers supply a large share of California's winter precipitation in most years, according to research summarized by NOAA. These narrow bands of concentrated water vapor, nicknamed "rivers in the sky," deliver huge moisture totals in a few days. The storm's temperature decides whether that moisture becomes snowpack or fast rain runoff.
A cold atmospheric river aimed at the Sierra Nevada builds snow more efficiently than almost any other California storm. A warm atmospheric river, sometimes called a "Pineapple Express" for its subtropical moisture, delivers similar totals mostly as rain. The difference between cold and warm atmospheric rivers is often the biggest factor separating a winter that builds snowpack from one that brings floods and little stored snow.
Why Can Early Melt Create Both Flood and Supply Problems?
Early melt creates flood problems because warm storms and hot spring weather melt snow faster than rivers, flood channels and reservoir operators can handle. When a large amount of snow melts over days instead of weeks, reservoir operators must release water for flood safety instead of storing it for later.
Early melt also creates a supply problem. Snow that runs off in March instead of May and June leaves less water in the mountains for the hottest, driest months, when farm and city demand peaks. Reservoir operators must release enough water to control flooding while holding enough back for summer demand and minimum river flows for fish.
Fast melt shortens the time operators have to balance those two goals. That is why water managers watch melt timing as closely as total snowpack. Flooding and summer shortage are separate outcomes of the same event, and a fast melt can cause both.
Warming winters are raising snow levels and moving snowmelt earlier in spring, according to NOAA and university researchers. Historically, a snowpack melting gradually through April, May and June spread water across the months when farms and cities need it most.
A snowpack that melts mostly in March shortens that buffer. Reservoir operators then manage a shorter, more intense runoff period with the same storage capacity. Some California reservoirs now use forecast-informed operations: when runoff forecasts are reliable, operators hold more water later into the season instead of following fixed calendar-based flood-control rules.
Where Can You Check the Current Snowpack?
Check current snowpack on the California Department of Water Resources' statewide snow-water-content maps, which combine snow pillow and snow course data. On those maps, the key number is percent of normal for that date: current snow-water equivalent compared with the historical average for the same calendar date. Unless the map says so, the figure is not a comparison with the April 1 peak.
A December reading looks very different from an April reading at the same site even in an average year. The date attached to a snowpack figure changes what the number means.
For seasonal climate context, the NOAA Climate Prediction Center and NOAA Climate.gov publish analysis beyond single snowpack readings. For storms and snow levels in Southern California's mountains, the NWS Los Angeles/Oxnard office and the NWS San Diego office issue point forecasts and snow level guidance. Before driving to Wrightwood or Big Bear Lake after a storm, check Caltrans QuickMap for chain controls.
California's snowpack stores water as ice at elevation and releases it on a schedule the state depends on. Before drawing conclusions from any snowpack statistic, check its date and normal period on the Department of Water Resources' current maps. Weigh it alongside reservoir storage and your local water supplier's outlook. For a snow trip to Big Bear Lake or Wrightwood, check WeatherLA's forecast and snow level pages before you go.