To check flood risk for a Los Angeles address, start with LA County Public Works' Flood Zone Determination website, which shows FEMA flood zones for any parcel in the county. Then check California's Best Available Maps for 200- and 500-year floodplains, and the USGS debris-flow viewer if you live below a recent burn scar. A "Zone X" result means lower risk, not no risk.
The difference between Zone X and no risk matters more in Los Angeles than in most places. Type your address into the FEMA map and you will probably see Zone X. Yet a 2022 UC Irvine study estimated that a 100-year storm could put between 197,000 and 874,000 people across the Los Angeles area in water more than about a foot deep. The study's middle estimate, 425,000 people, is far more than federal maps suggest.
Both are accurate, because they measure different things. With NOAA giving a very strong El Niño better than 90% odds this winter, this is a good year to know what each map shows.
How Do You Check Flood Risk for a Los Angeles Address?
Checking flood risk for a Los Angeles address takes three maps, in order. First, enter your address or Assessor's Parcel Number on the county's Flood Zone Determination website, select the parcel, and use the Identify tool to read its FEMA zone.
Second, open the state's Best Available Maps from the Department of Water Resources, which add 200- and 500-year floodplains and areas FEMA has not mapped. Third, if you live below hillsides that burned in the last few years, check the USGS debris-flow viewer. Each map answers a different question. For the neighboring county, see flash flooding in Orange County.
| Your question | Where to look |
|---|---|
| Am I in a FEMA flood zone? Does my lender require flood insurance? | LA County Flood Zone Determination site, or FEMA’s Flood Map Service Center |
| Could a flood bigger than the 100-year event reach me? | California DWR Best Available Maps (100-, 200- and 500-year floodplains) |
| Am I below a recent burn scar? | USGS Post-Fire Debris Flow Hazard Assessment Viewer |
| Is flooding happening now? | National Weather Service warnings and your city’s alerts, not a map |
| How deep could a big flood get on my street? | Research models such as UC Irvine’s; most of LA has no official street-level depth map |
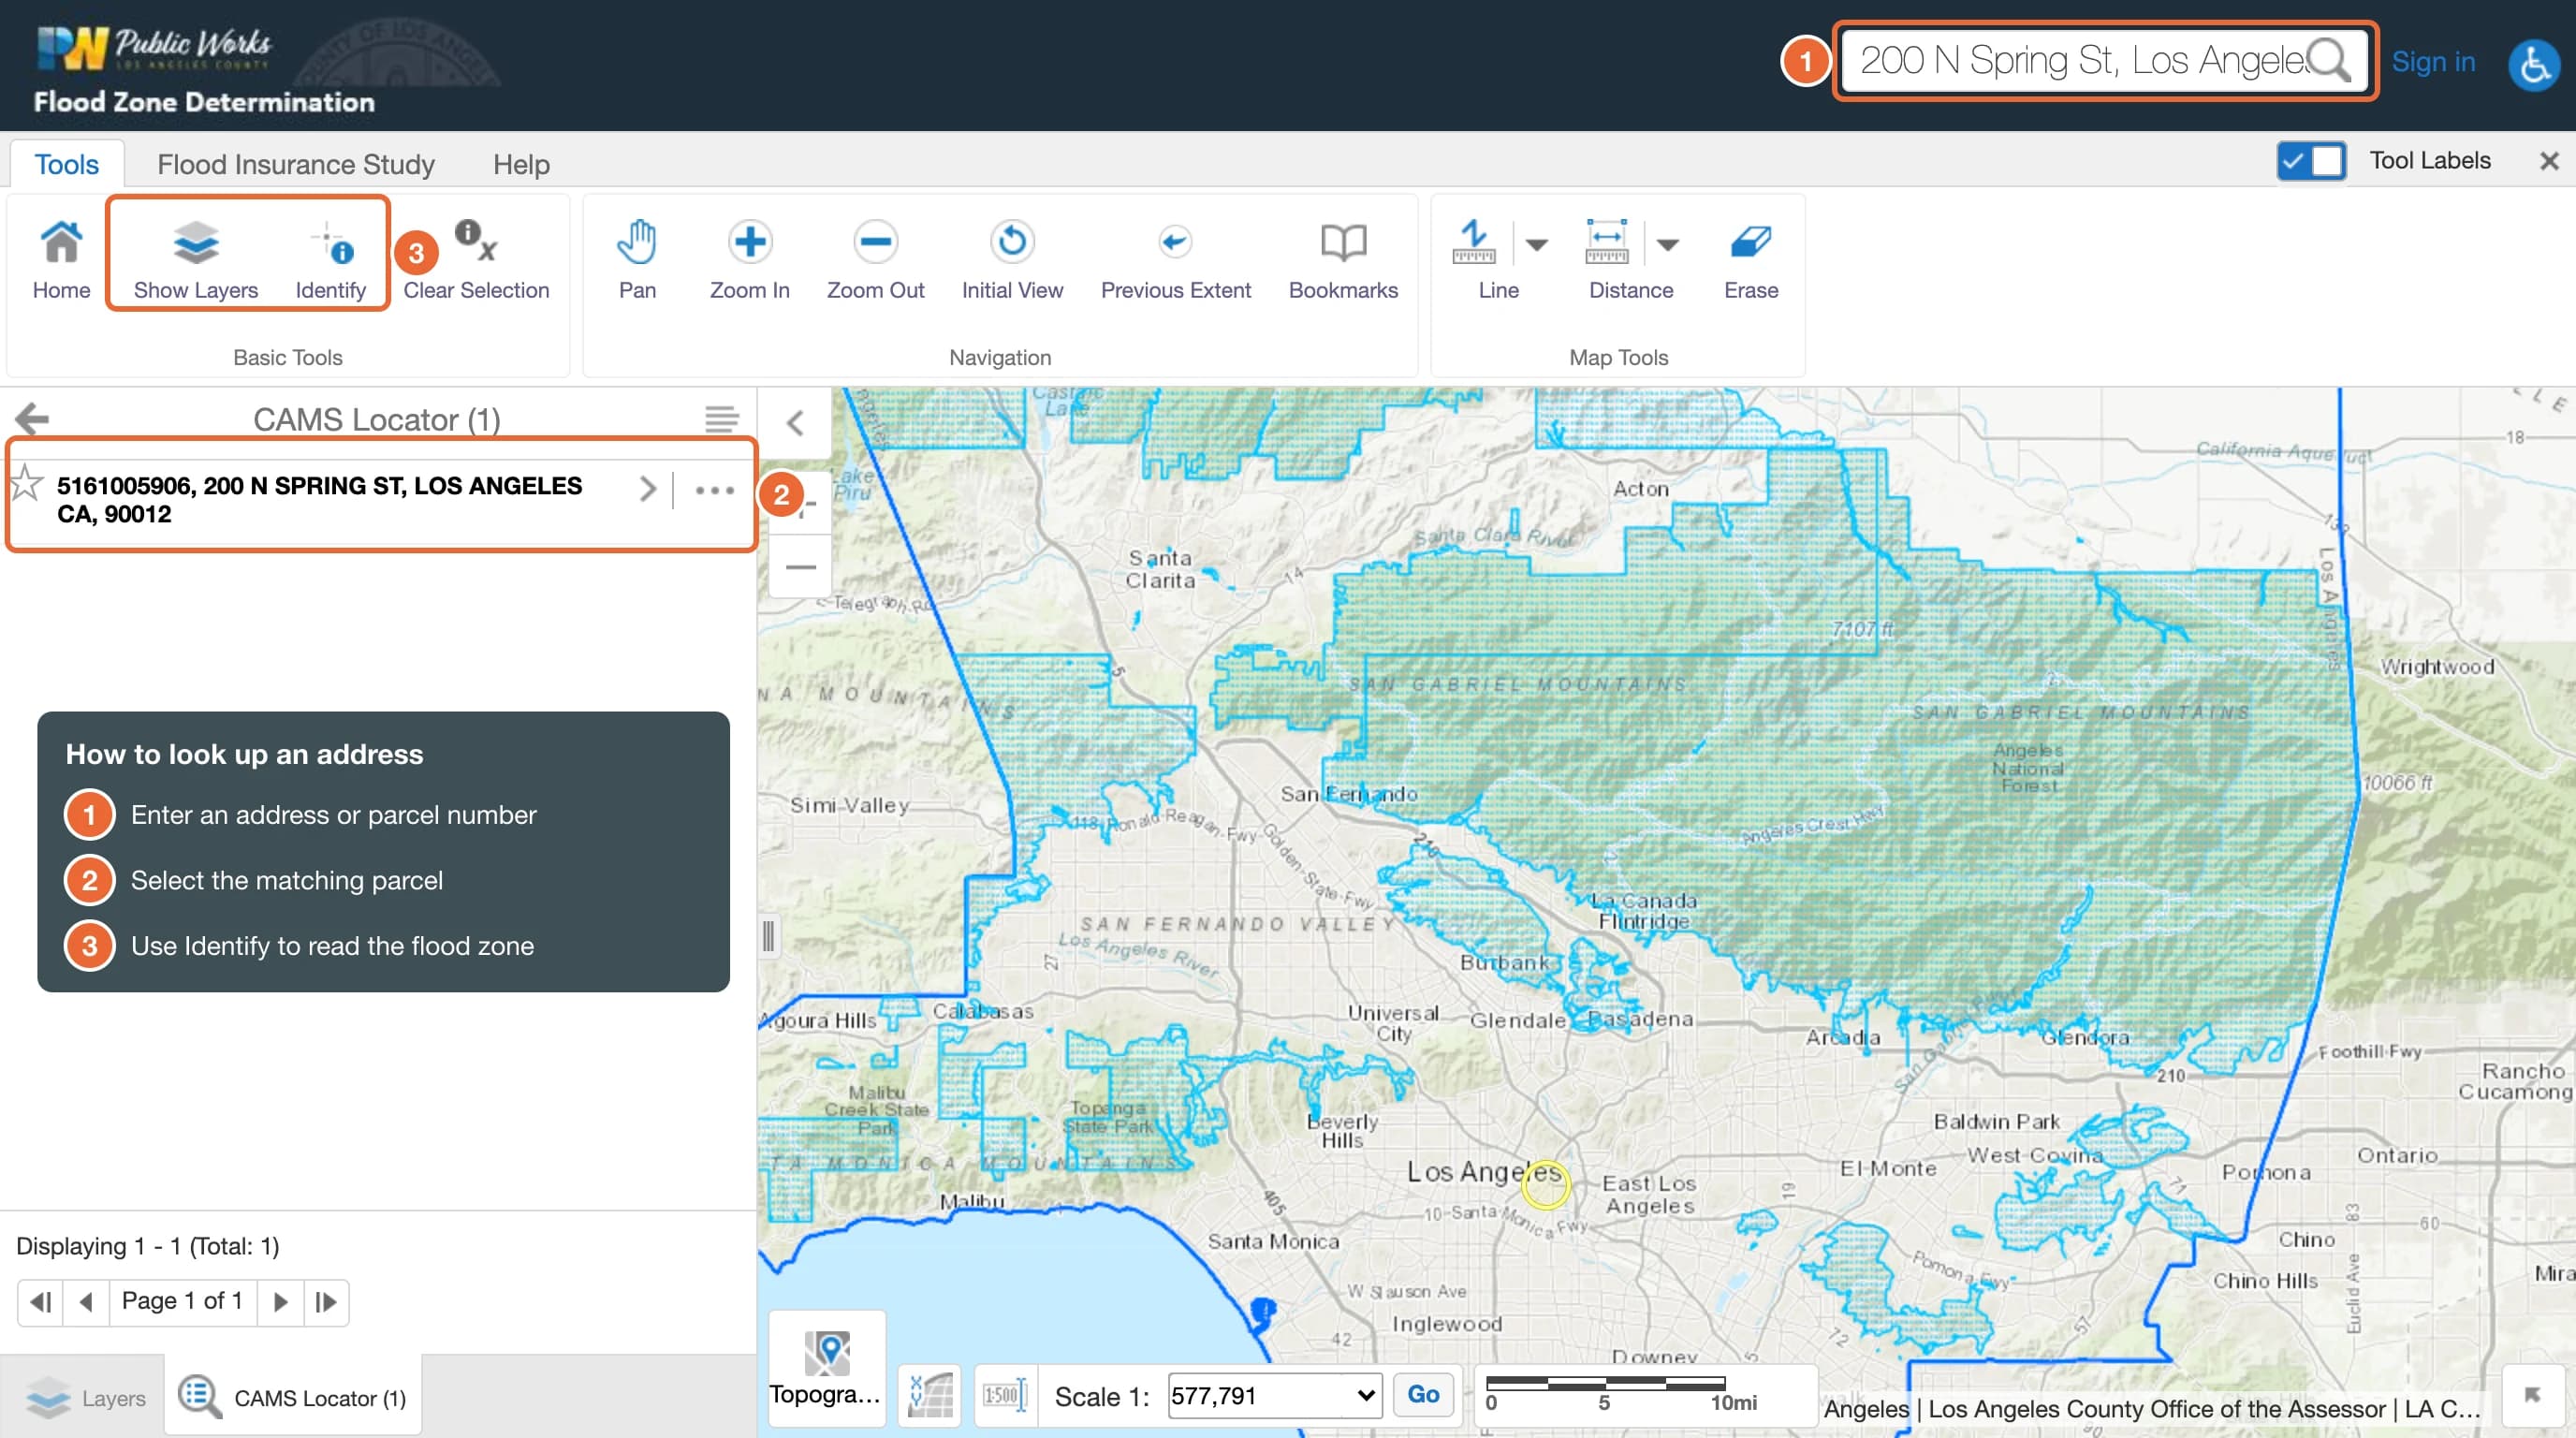
The official source behind the county site is FEMA's Flood Map Service Center, where you can download the Flood Insurance Rate Map panel for your address. Lenders and insurers use those panels, so if the two ever disagree, the FEMA map is the one that counts for insurance. For the low, flat end of the river system, see flash flooding in Long Beach.
What Do FEMA Flood Zones Mean for Your Home?
Zones starting with A or V are high-risk Special Flood Hazard Areas, with at least a 1% chance of flooding in any year. That sounds small, but FEMA notes it equals about a 1 in 4 chance of flooding at least once over a 30-year mortgage. Zone X covers everything else that has been studied, and Zone D means the hazard is possible but has not been analyzed.
| Zone | What it means | Flood insurance |
|---|---|---|
| A, AE, AH, AO | High risk: at least a 1% chance of flooding each year | Required for federally backed mortgages |
| V, VE | High risk on the coast, with wave action | Required for federally backed mortgages |
| X (shaded) | Moderate risk: between the 1% and 0.2% annual chance floodplains | Optional |
| X (unshaded) | Minimal risk: outside the 0.2% annual chance floodplain | Optional |
| D | Possible but undetermined hazard; not studied | Optional |
Two insurance facts surprise many homeowners. Most standard homeowners policies do not cover flood damage; flood insurance is a separate policy. And according to FEMA, a new National Flood Insurance Program policy typically has a 30-day waiting period before it takes effect, unless it is required by a lender at closing or tied to a flood map change. Buying one when a storm is already in the forecast is usually too late.
Why Might FEMA Maps Understate LA's Flood Risk?
FEMA maps can understate LA's flood risk because they were built for insurance and regulation, not as a complete picture of what water can do in a dense, paved city. The UC Irvine team, led by civil engineer Brett Sanders, modeled rain, river flow and storm tides together across the Los Angeles basin. Their study in Nature Sustainability found $36 billion to $108 billion in property exposed to more than about a foot of water in a 100-year flood, with the risk falling disproportionately on Black and lower-income communities.
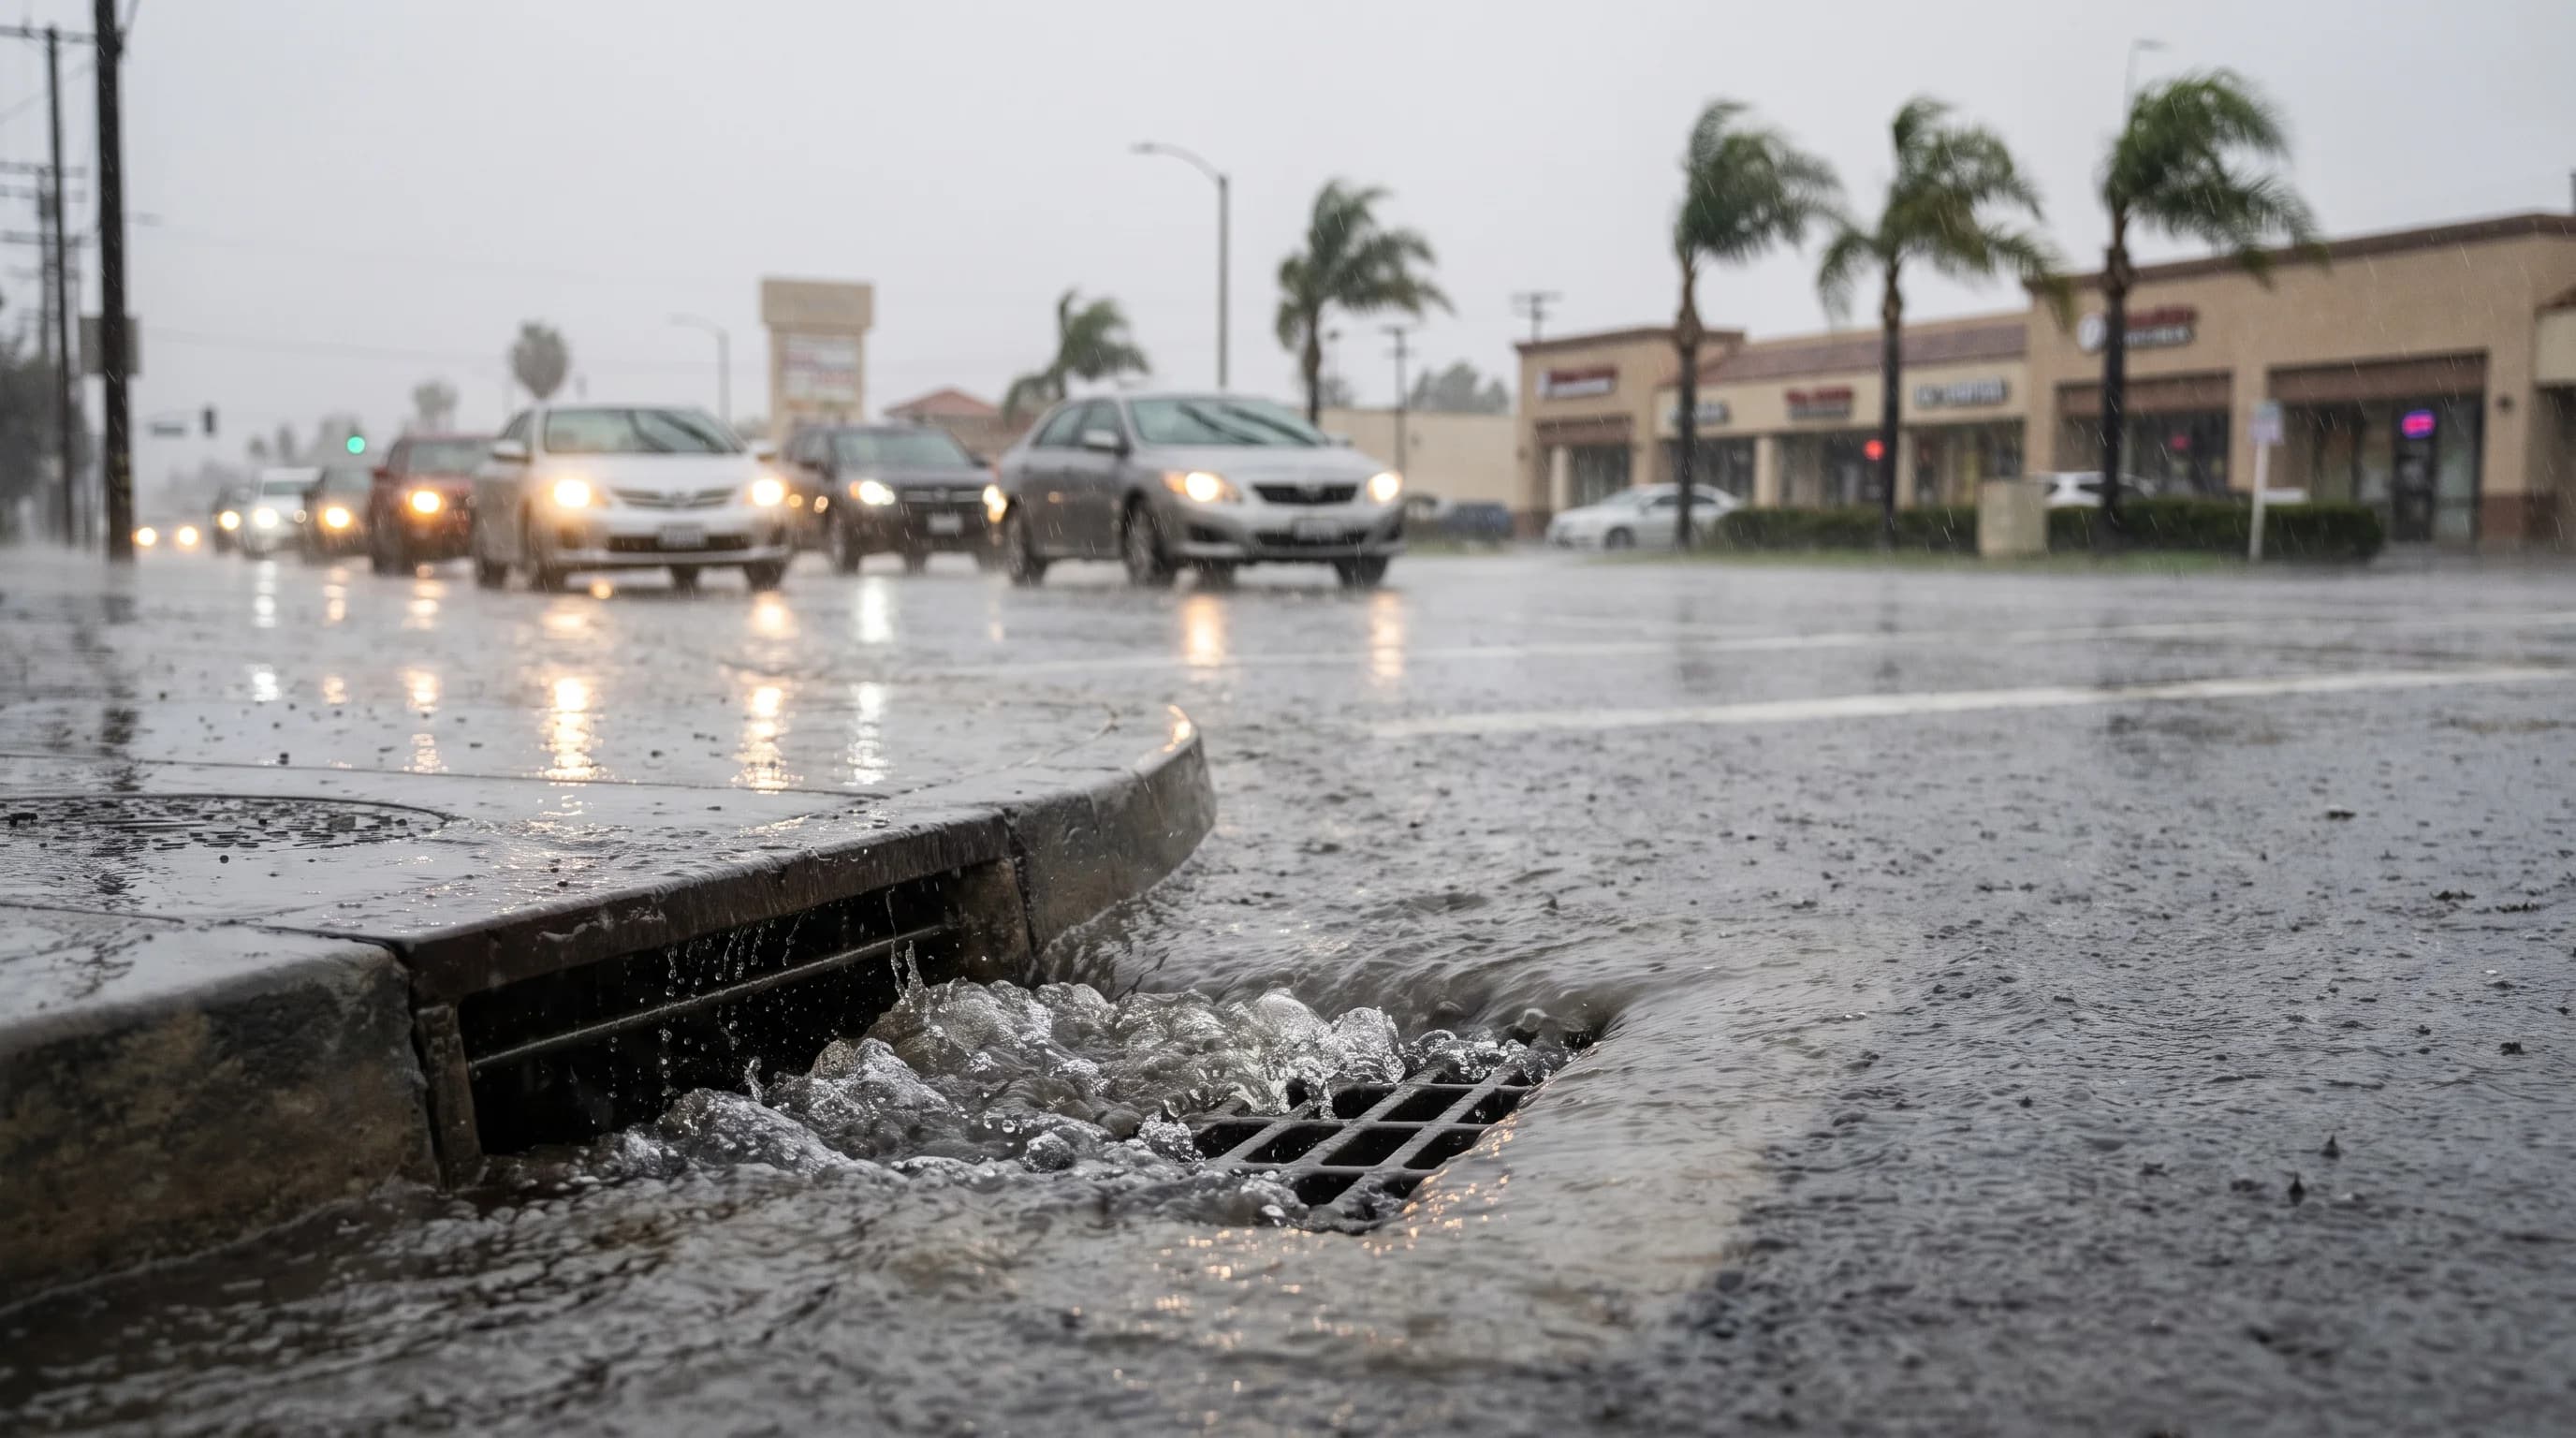
Much of that exposure comes from flooding that FEMA maps are not designed to show: rain falling faster than storm drains can carry it, water pooling in low streets and underpasses, and flood channels designed decades ago for smaller storms. That street flooding differs from a river flood, as explained in flood vs. flash flood and why LA floods so fast.
How Do You Check Debris-Flow Risk Below a Burn Scar?
Debris-flow risk below a burn scar is mapped in the USGS Post-Fire Debris Flow Hazard Assessment Viewer. Choose a fire from the Select by Fire menu, such as the January 2025 Eaton or Palisades fires. The map then colors each drainage basin by the likelihood of a debris flow, its potential volume and a combined hazard rating, along with the rainfall intensity that could trigger one. The Palisades Fire burned 23,448 acres and the Eaton Fire 14,021 acres, and USGS assessed both.
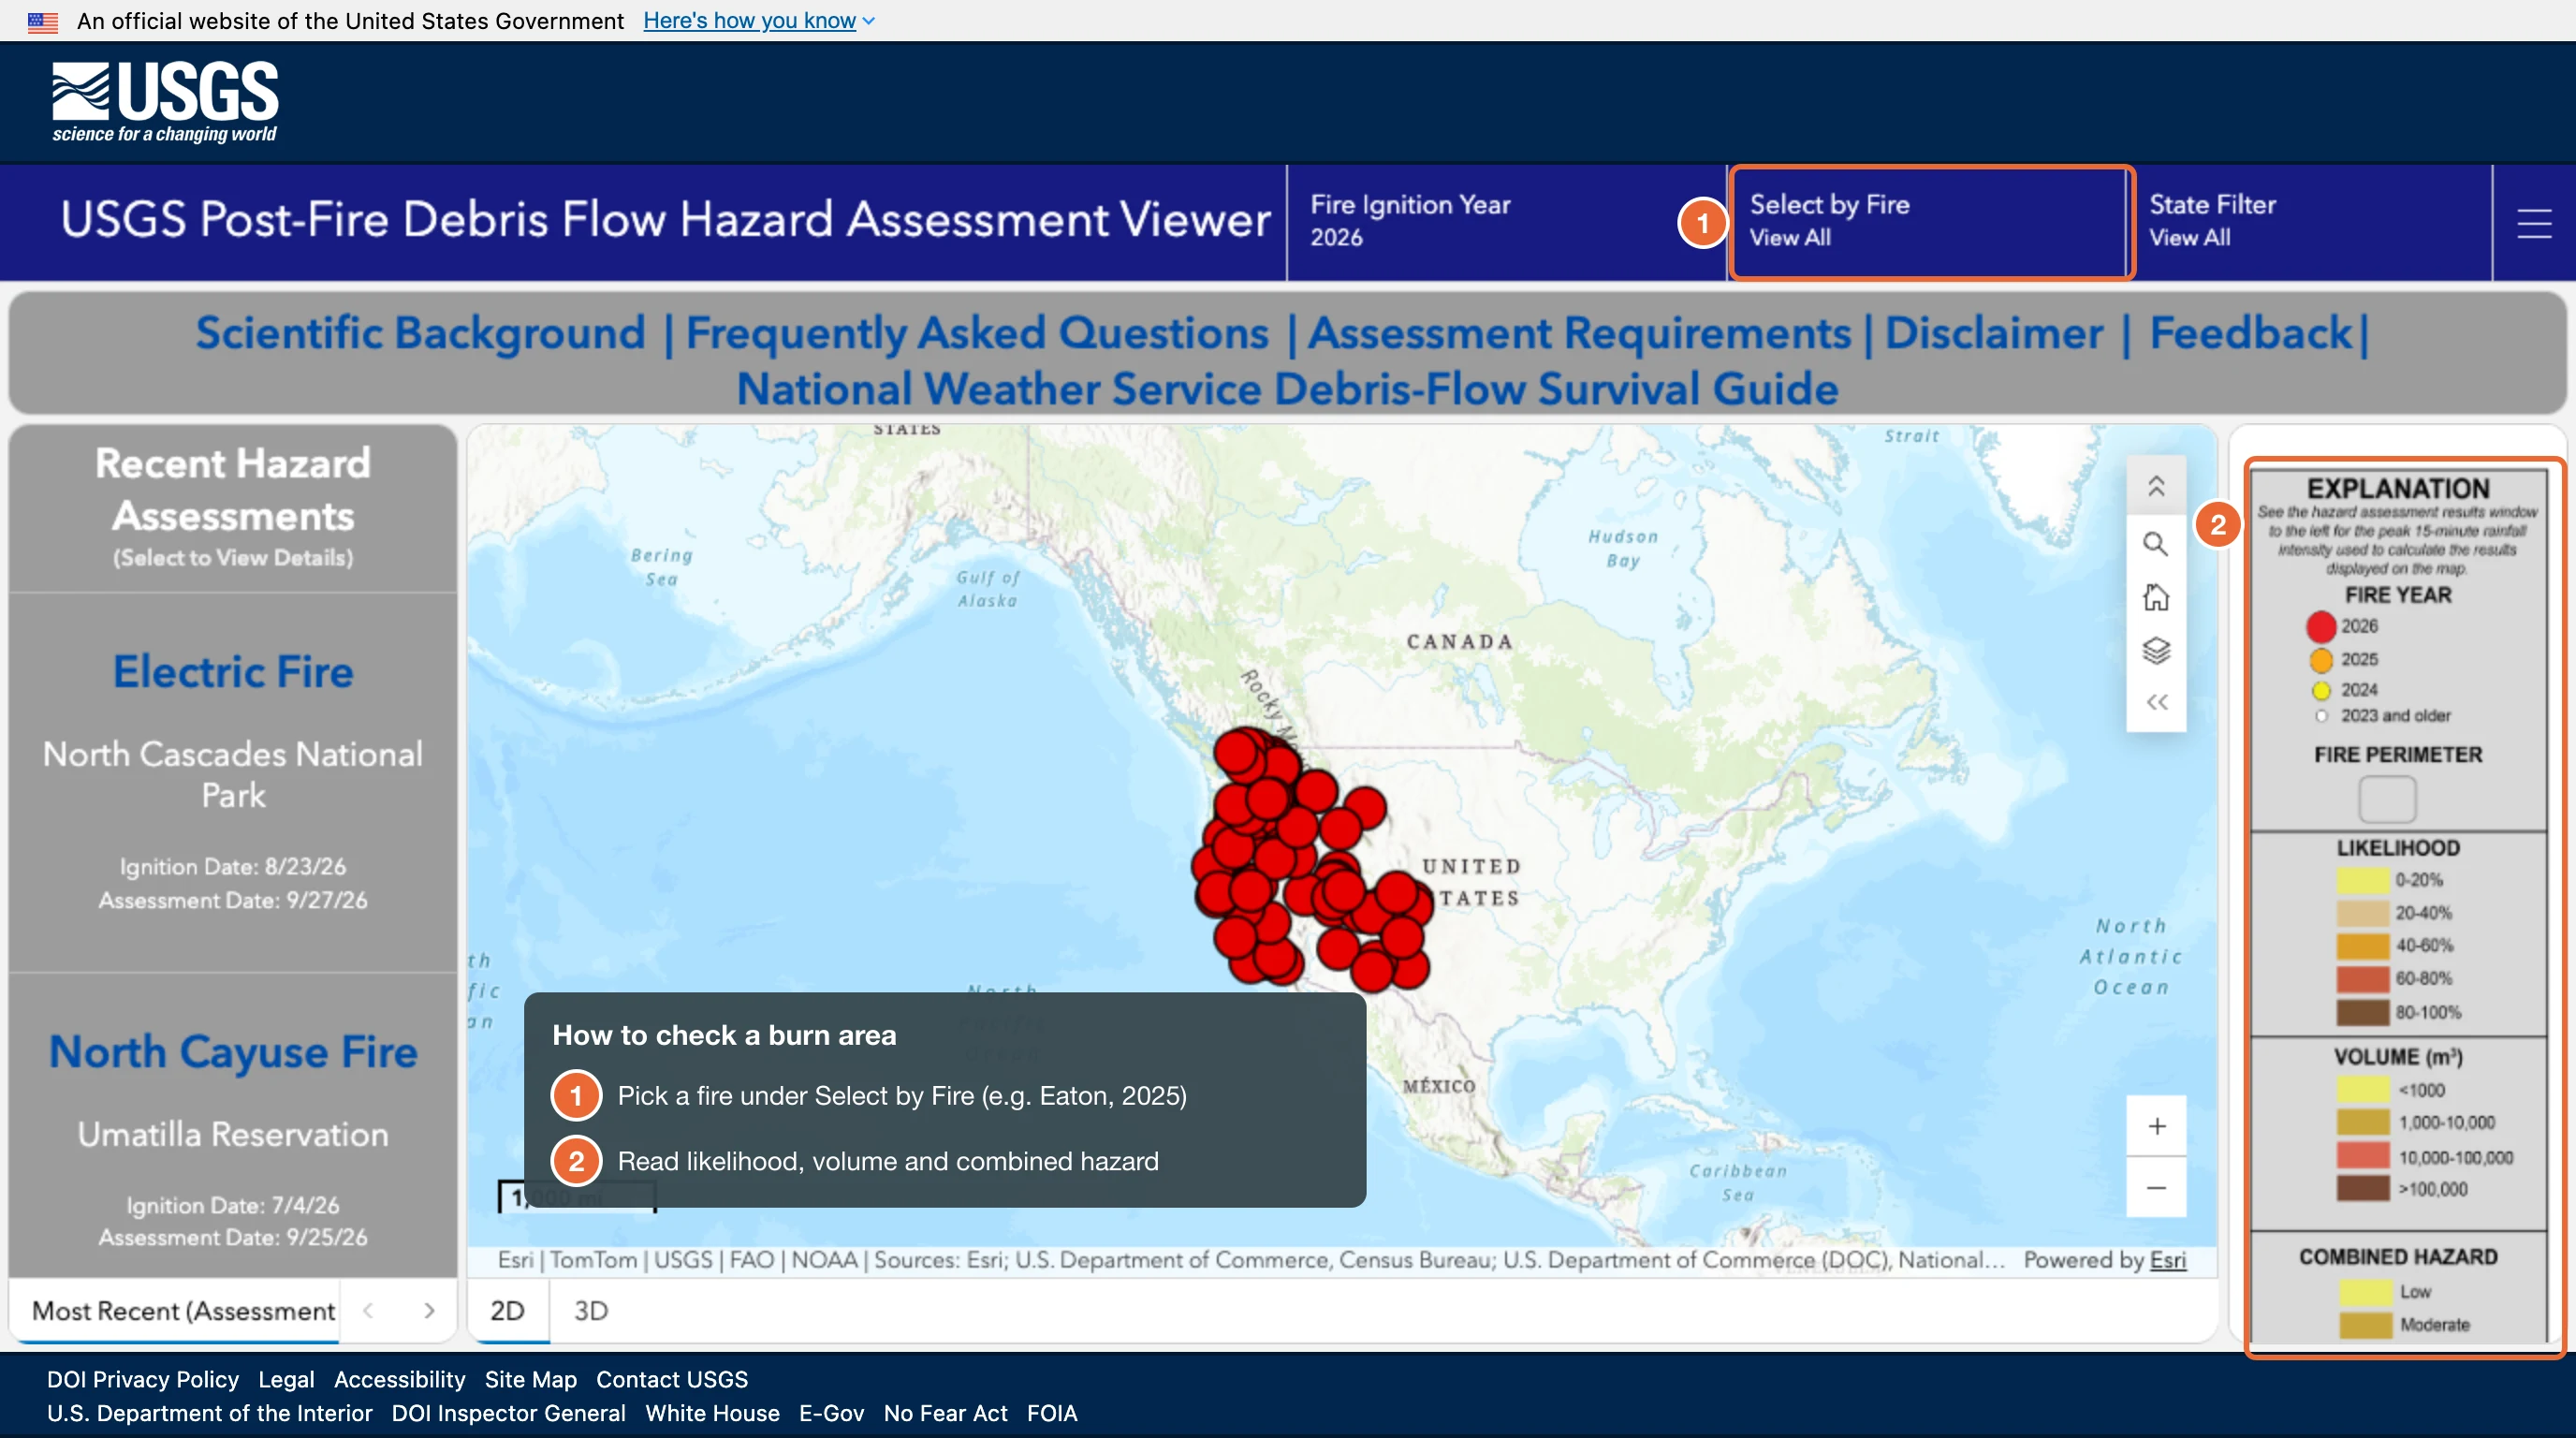
Debris-flow danger is highest in the first few winters after a fire, before roots and ground cover return, and a short burst of intense rain can trigger a debris flow even without a big storm total. Homes near canyon mouths and along channels below burned slopes are the most exposed. The debris-flow explainer covers how they form, and LA mudslides covers slope failures outside burn areas.
What Can Flood Maps Not Tell You?
Flood maps show long-term risk, not tonight's danger. They do not show which storm drain on your block clogs, which underpass fills first, or which hillside above your street is saturated after a week of rain. They also miss hazards that are not river floods: mudslides on unburned slopes, and coastal flooding when high tides and big surf combine, which is covered in king tides in Southern California. Your own experience matters: if water has pooled at your curb or driveway in past storms, it will likely pool there again.
What Should You Do Before a Big El Niño Storm?
Before a big El Niño storm, check your address on the three flood maps while skies are dry. Then start with the steps that take longest. If you want flood insurance, buy it early because of the 30-day wait.
Sign up for your city's emergency alerts and, if you live near a burn scar, learn your evacuation zone. Before each storm, clear leaves from gutters and the storm drain at your curb, and move cars out of low spots and underground garages that have flooded before.
During a storm, trust warnings over maps. A flash flood warning or debris-flow evacuation order means act now, whatever your zone says; the difference between watches and warnings is explained in what LA's weather alerts mean. Never drive into water on a road, and stay out of channels and washes during and after heavy rain.
Los Angeles has flooded worse than any modern map shows: during the Great Flood of 1862, its rivers overflowed for a month. A flood map is a starting point, not the final word. Look up your address, read what each map can and cannot show, and pair it with a live forecast: our Downtown Los Angeles page shows rain timing and totals as the next storm approaches.