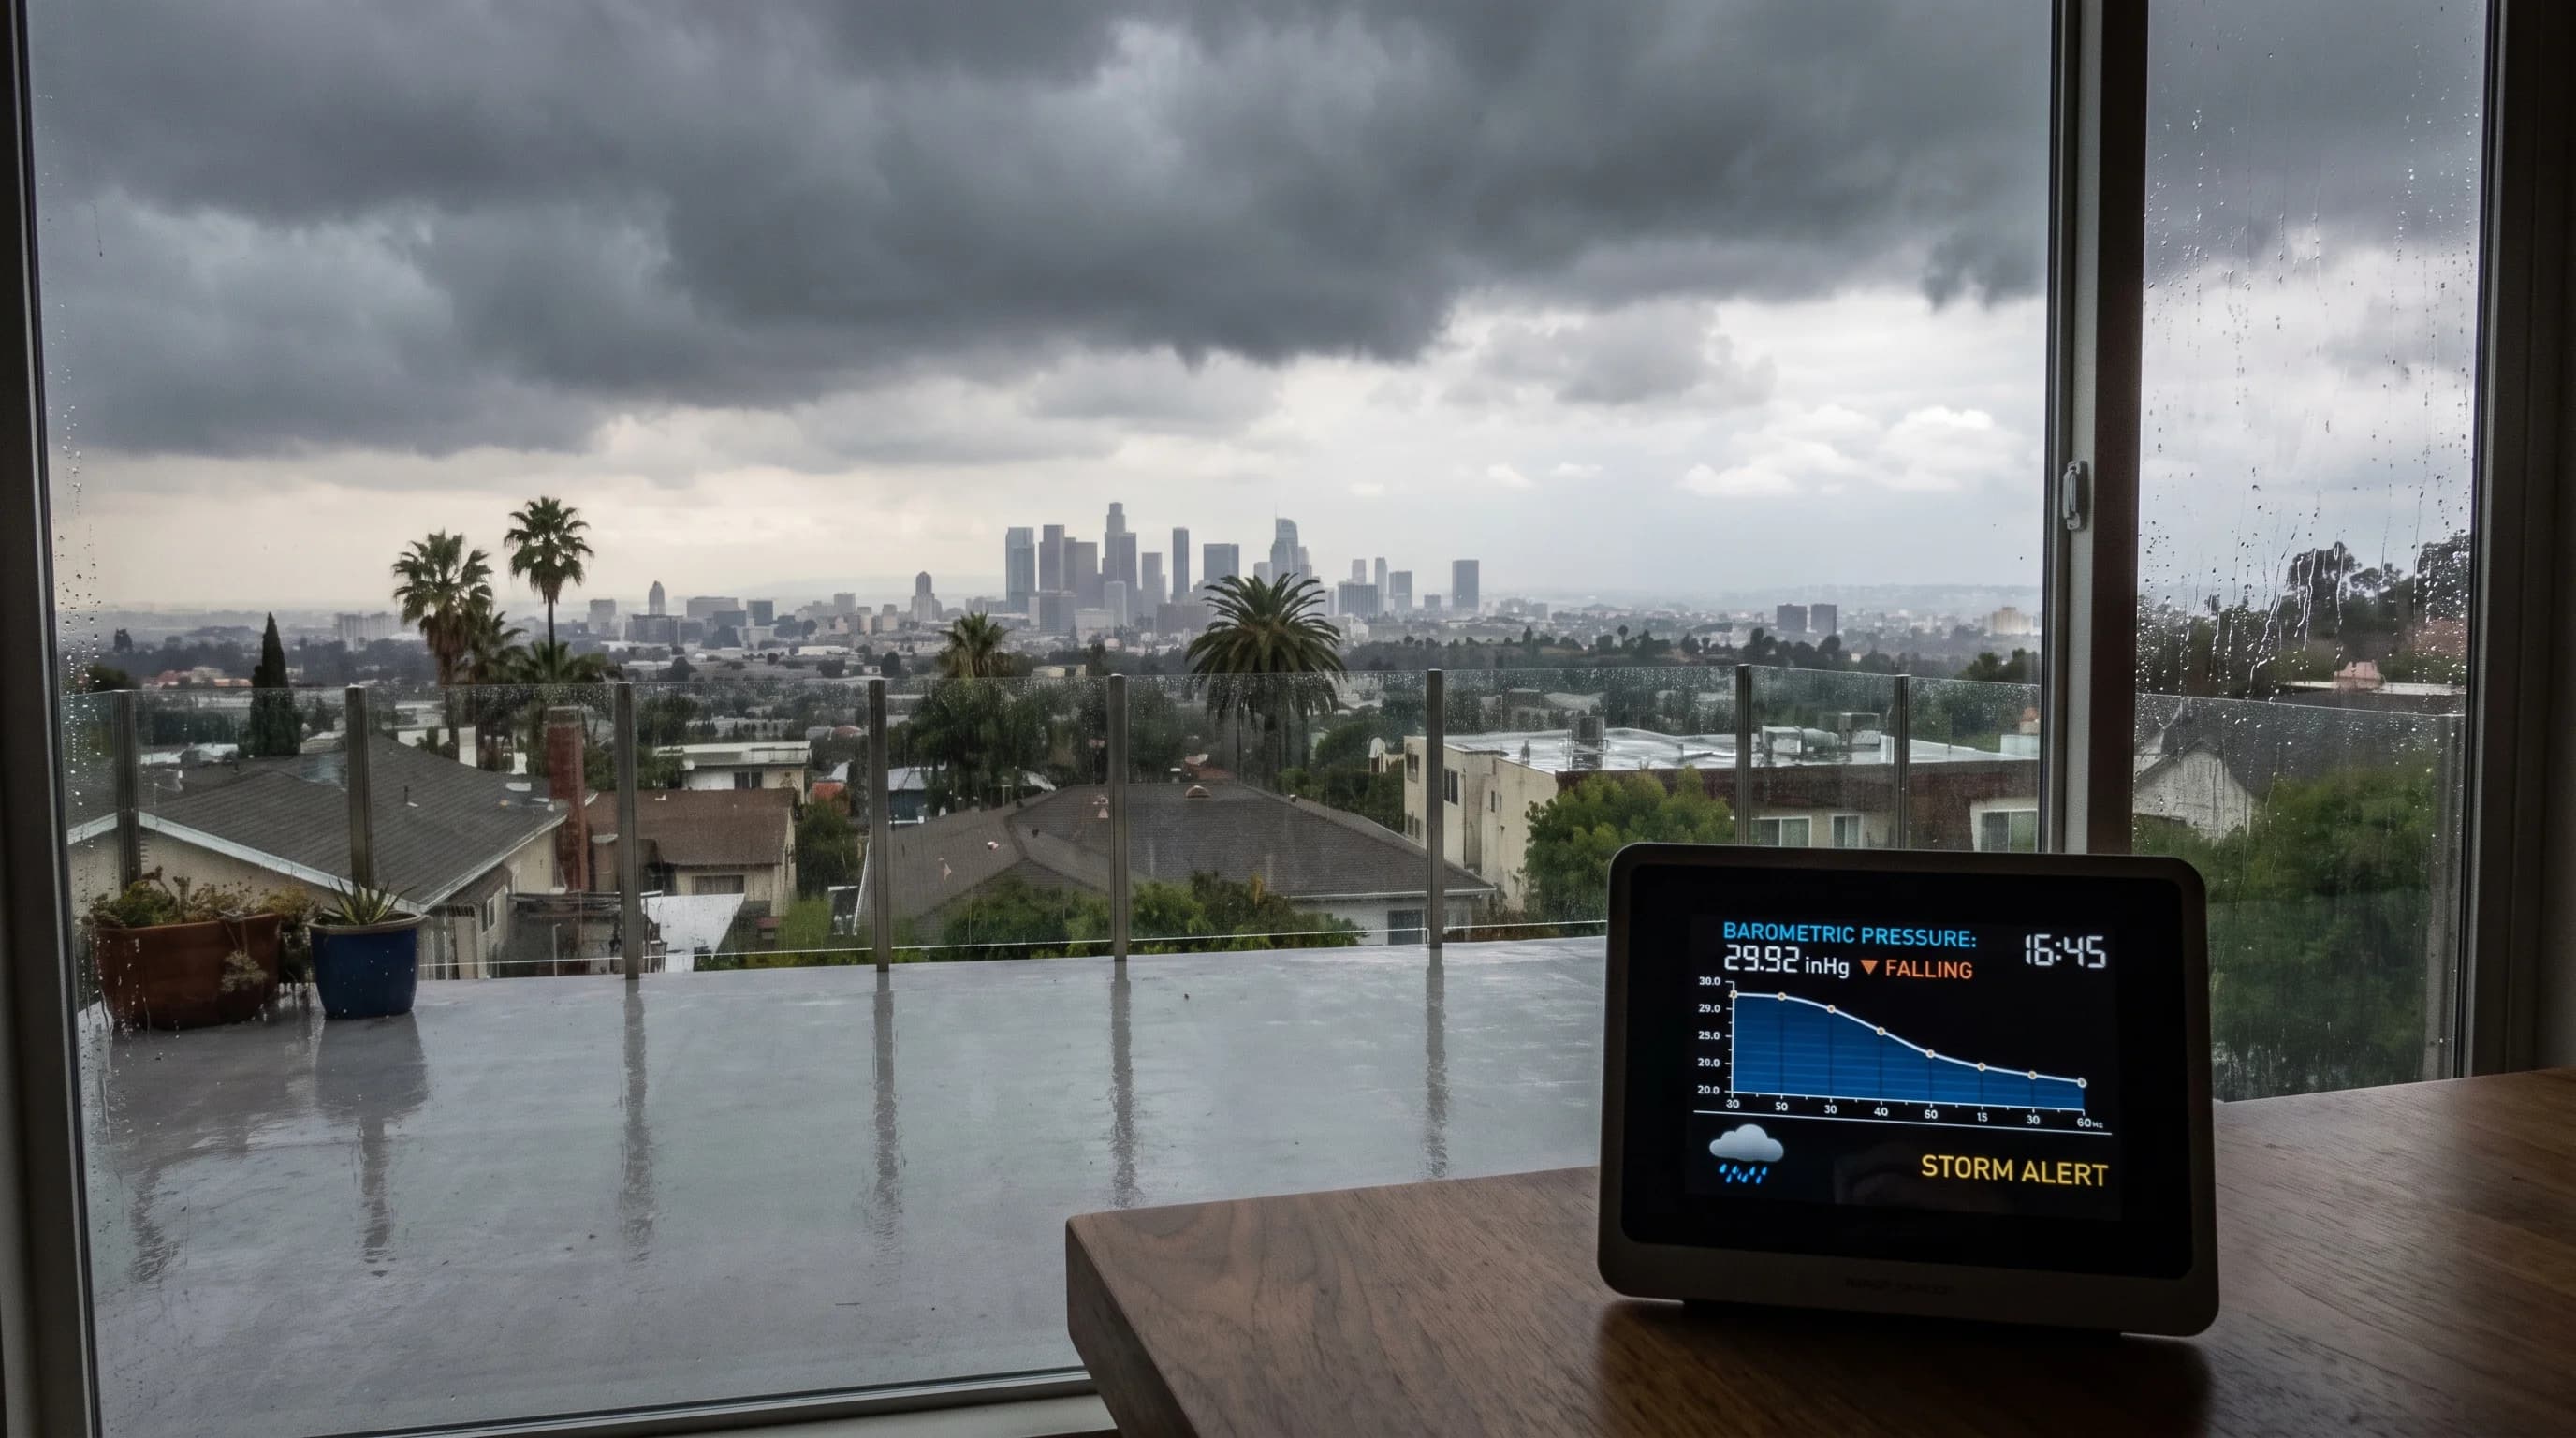
Barometric pressure is the weight of the air column pressing down on a location, and it usually falls in the hours before a Los Angeles storm. An approaching low pressure system has air rising and spreading out aloft faster than surface air can replace it, which lowers the pressure. A steady fall over several hours is a real storm signal, used for centuries, but it is not a forecast by itself. A pressure reading needs a trend, a comparison station and an official map to say when rain will start in Downtown Los Angeles or anywhere in the basin.
What Is Barometric Pressure?
Barometric pressure, also called atmospheric or station pressure, is the force of the whole column of air above a point, measured at that point's elevation. Average sea-level pressure is about 29.92 inches of mercury (inHg), or 1013.25 millibars (mb), the standard reference in meteorology. Pressure drops with altitude because less air sits overhead, so a mountaintop station reads lower than a beach station in the same weather.
Meteorologists convert station pressure to sea-level pressure with a standard correction for elevation, so readings from different heights can be compared. That is how a National Weather Service Los Angeles/Oxnard surface map can show a coastal station and Big Bear Lake, about 6,750 feet higher, on the same scale. An uncalibrated home barometer reads local station pressure. Two barometers in the same storm can show different numbers while agreeing on the trend, which is what matters.
| Sea-level pressure | Millibars (mb) | What it typically indicates |
|---|---|---|
| Above 30.20 inHg | Above 1022 mb | Strong high pressure; clear skies and light wind are typical, and in fall or winter this range can accompany an offshore Santa Ana pattern |
| 29.90 to 30.20 inHg | 1012 to 1022 mb | A common fair-weather range for low-elevation Southern California stations on an ordinary day |
| 29.70 to 29.90 inHg | 1006 to 1012 mb | Below-average pressure; often accompanies an approaching trough, increasing cloud cover, or a weaker Pacific storm system |
| Below 29.70 inHg | Below 1006 mb | A well-developed low pressure system; commonly associated with an active storm, sustained rain, and gusty wind, especially when the reading is still falling |
The ranges in the table are general guides, not fixed thresholds. A reading of 29.85 inHg that fell steadily from 30.10 inHg over six hours is a stronger storm signal than a reading of 29.75 inHg that has stayed flat for two days. The trend almost always tells more than the number.
Why Does Pressure Often Fall Before a Storm?
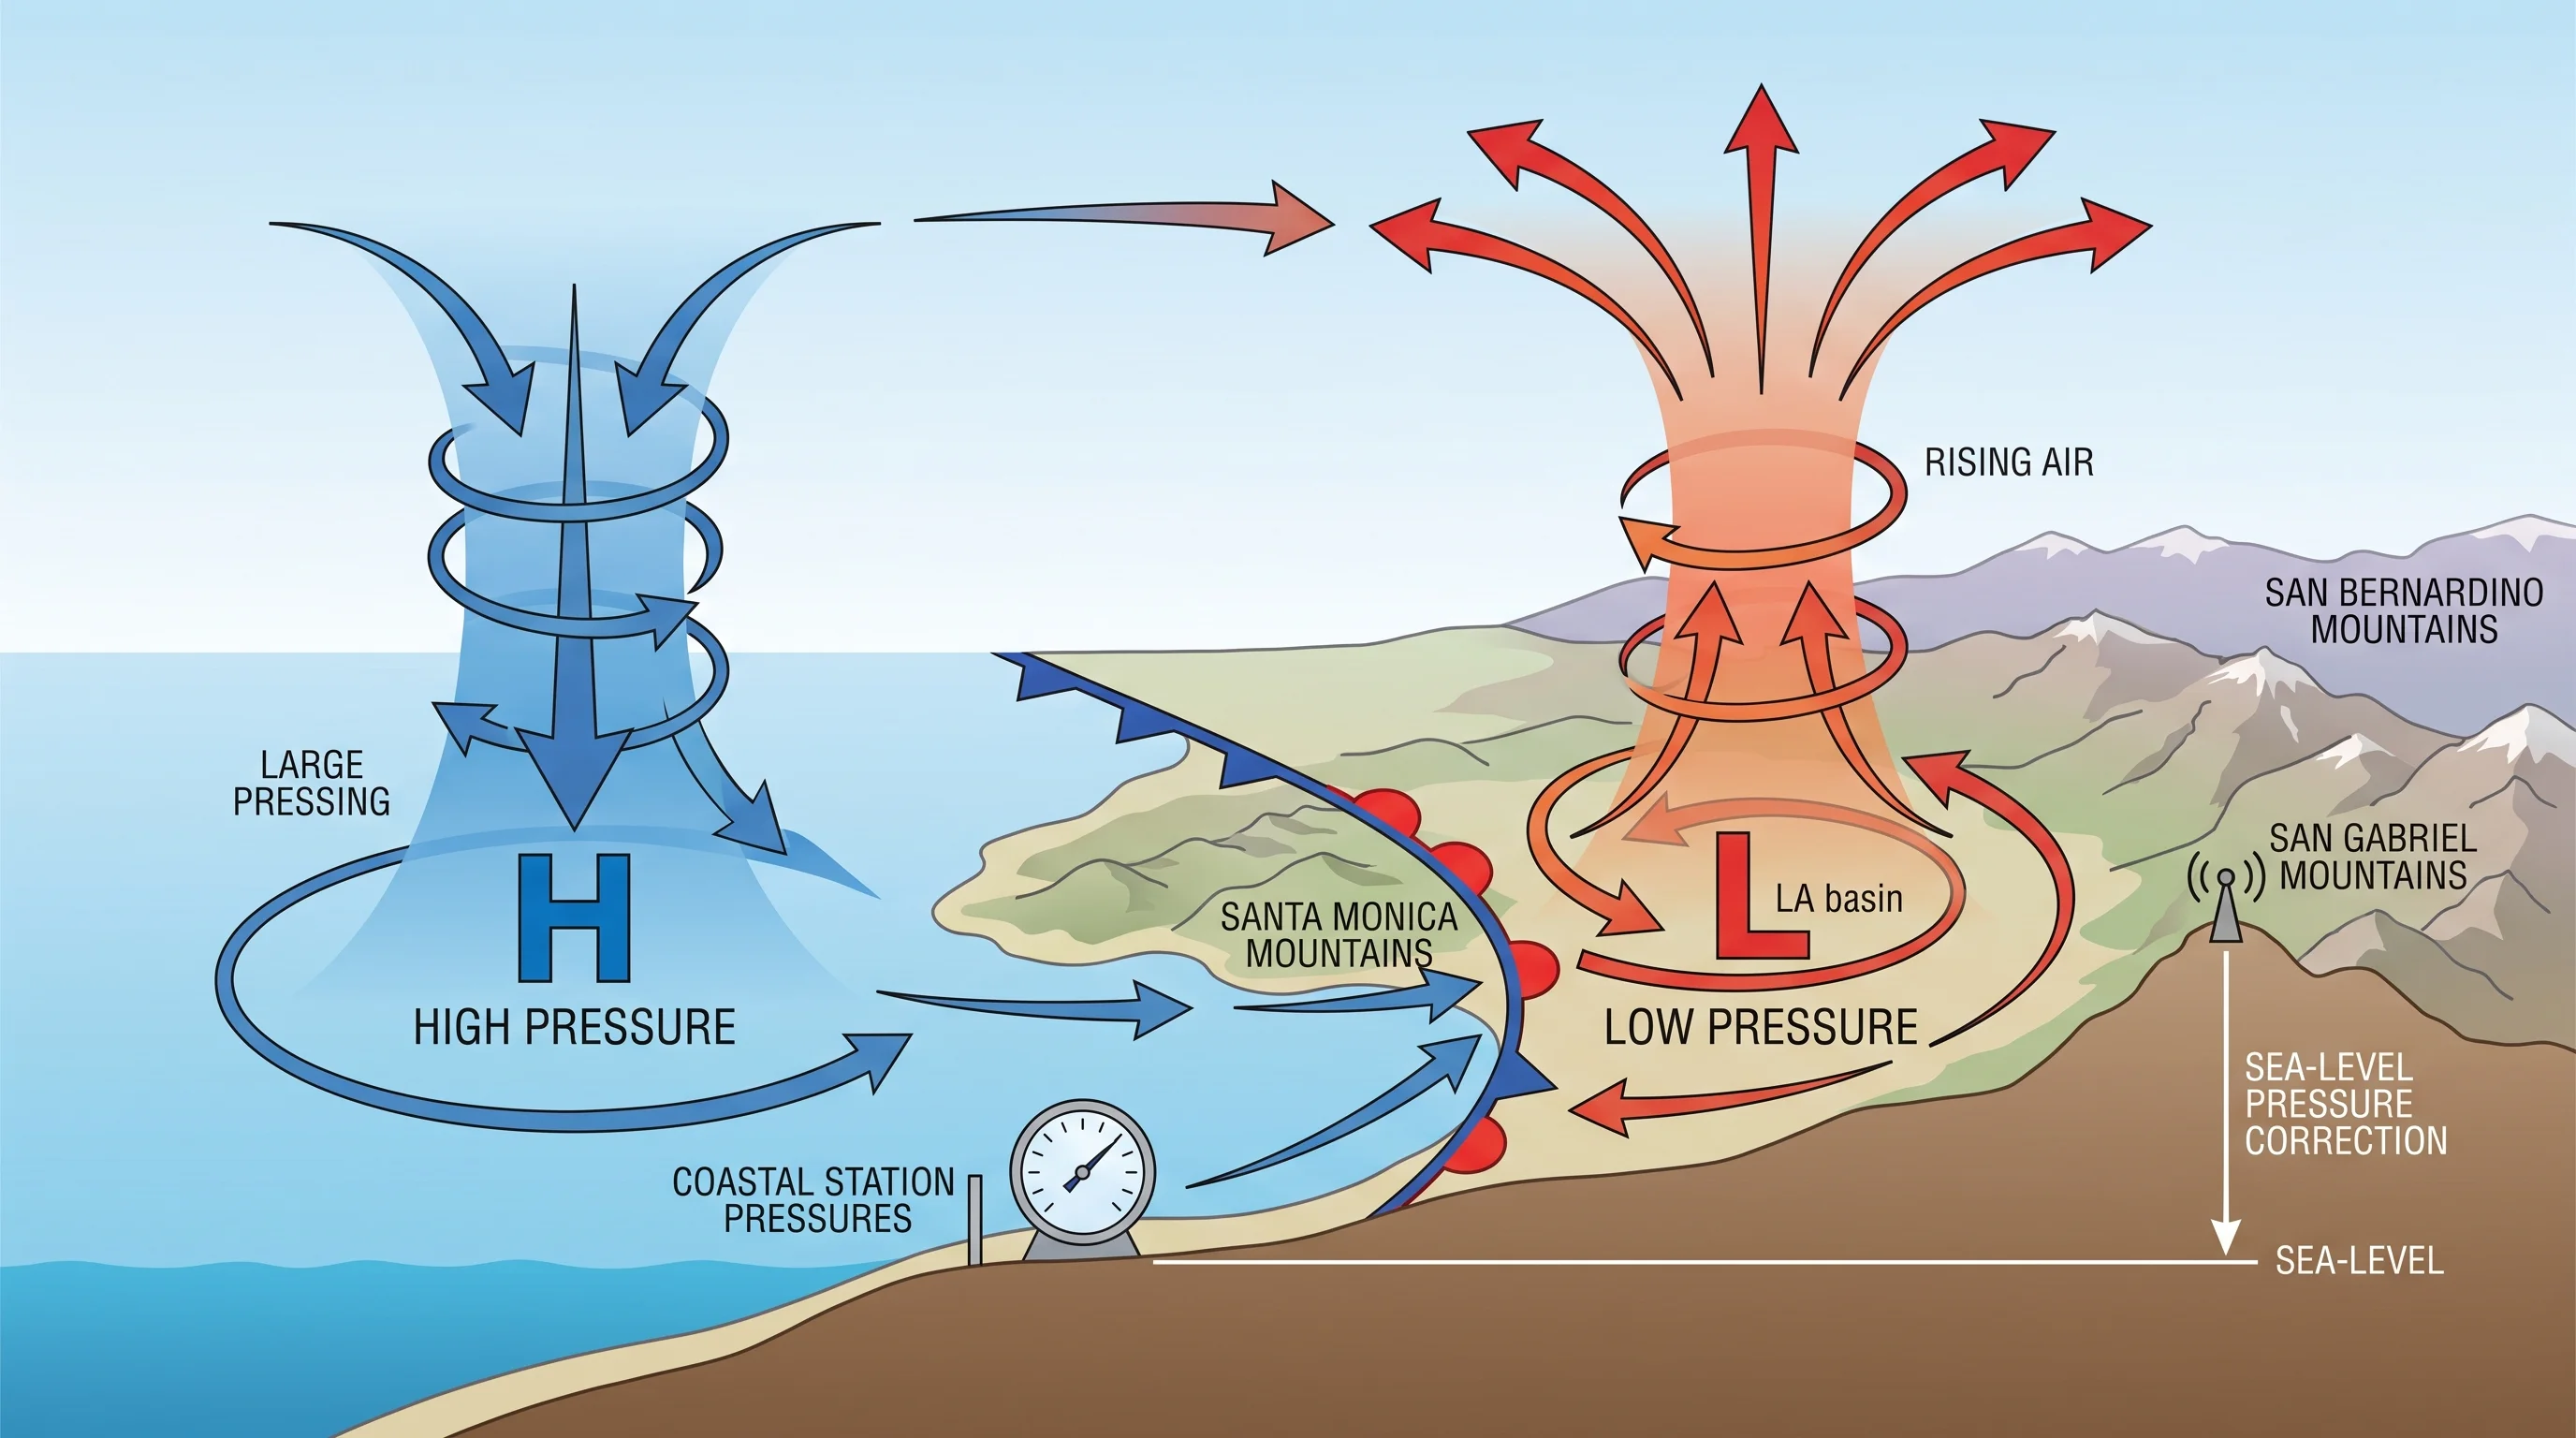
Pressure falls before a storm because a low pressure system is an area where rising air spreads out aloft faster than surface air can flow in to replace it. That lightens the air column and lowers the surface reading. As a Pacific low and its front approach Southern California, a station in its path usually records a steady, multi-hour pressure drop before clouds and rain arrive. Observers have used that link since the barometer's invention in the 17th century, and it remains one of the most dependable single signals in surface weather.
Forecasters watch the pressure tendency, the rate and direction of change over a set period, usually three hours. A fast fall of several millibars in a few hours points to a stronger storm than a slow fall. A very fast fall helps identify a bomb cyclone, the informal name for a storm whose central pressure drops at least 24 millibars in 24 hours, usually over open ocean. Pressure changes do not trigger earthquakes, a popular myth covered in is earthquake weather real.
Southern California rarely sits under a bomb cyclone's center, but a rapidly strengthening Pacific storm offshore can turn a routine storm into one that intensifies faster than forecast. The jet stream steers these storms toward or away from the coast; see the jet stream explained. A pressure trend only tells you a storm is developing or approaching.
How Do High and Low Pressure Affect Los Angeles Weather?
High pressure brings sinking air, which warms as it descends and prevents clouds, usually bringing clear skies and light wind. In Southern California, strong high pressure inland can also drive Santa Ana winds, dry, gusty offshore wind sinking and warming as it rushes downhill toward the coast. Low pressure brings rising air, which favors clouds, wind and, with enough moisture, rain. A deep low approaching from offshore is the setup forecasters watch most closely for wet weather.
Southern California's geography complicates the simple rule that high pressure means clear and low pressure means stormy. First, the coastal marine layer can bring overcast June Gloom under broad high pressure, because the marine layer and the storm pattern sit at different levels of the atmosphere. Second, the summer thermal trough, an area of lower pressure that forms inland as desert and valley air heats and rises, can pull in onshore wind and clouds with no storm at all.
Inland communities such as Woodland Hills often feel the thermal trough more strongly than the coast, because valley heating drives much of the pressure difference. A low reading alone does not mean a storm is coming; what causes it matters as much as the number.
What Counts as High or Low Pressure in Southern California?
No single pressure number means storm or fair weather everywhere in Southern California. A reading means something only when compared with that station's usual range for its elevation and season, and with its recent trend. The table above gives common ranges for low-elevation coastal and basin stations. The same reading would mean something entirely different at Big Bear Lake before the sea-level correction.
The National Weather Service reads pressure as a trend against each station's baseline, not against one global threshold. Forecast discussions describe change over time, such as "falling three millibars in the past three hours," instead of calling one value dangerous or calm.
A single home barometer reading, with no trend or map, says very little. The same 29.85 inHg could mean a storm deepening, a storm that already passed with pressure recovering or a weak disturbance that never brings rain. Only the trend, paired with an official forecast, shows which.
Can Pressure Alone Predict Rain or Physical Symptoms?
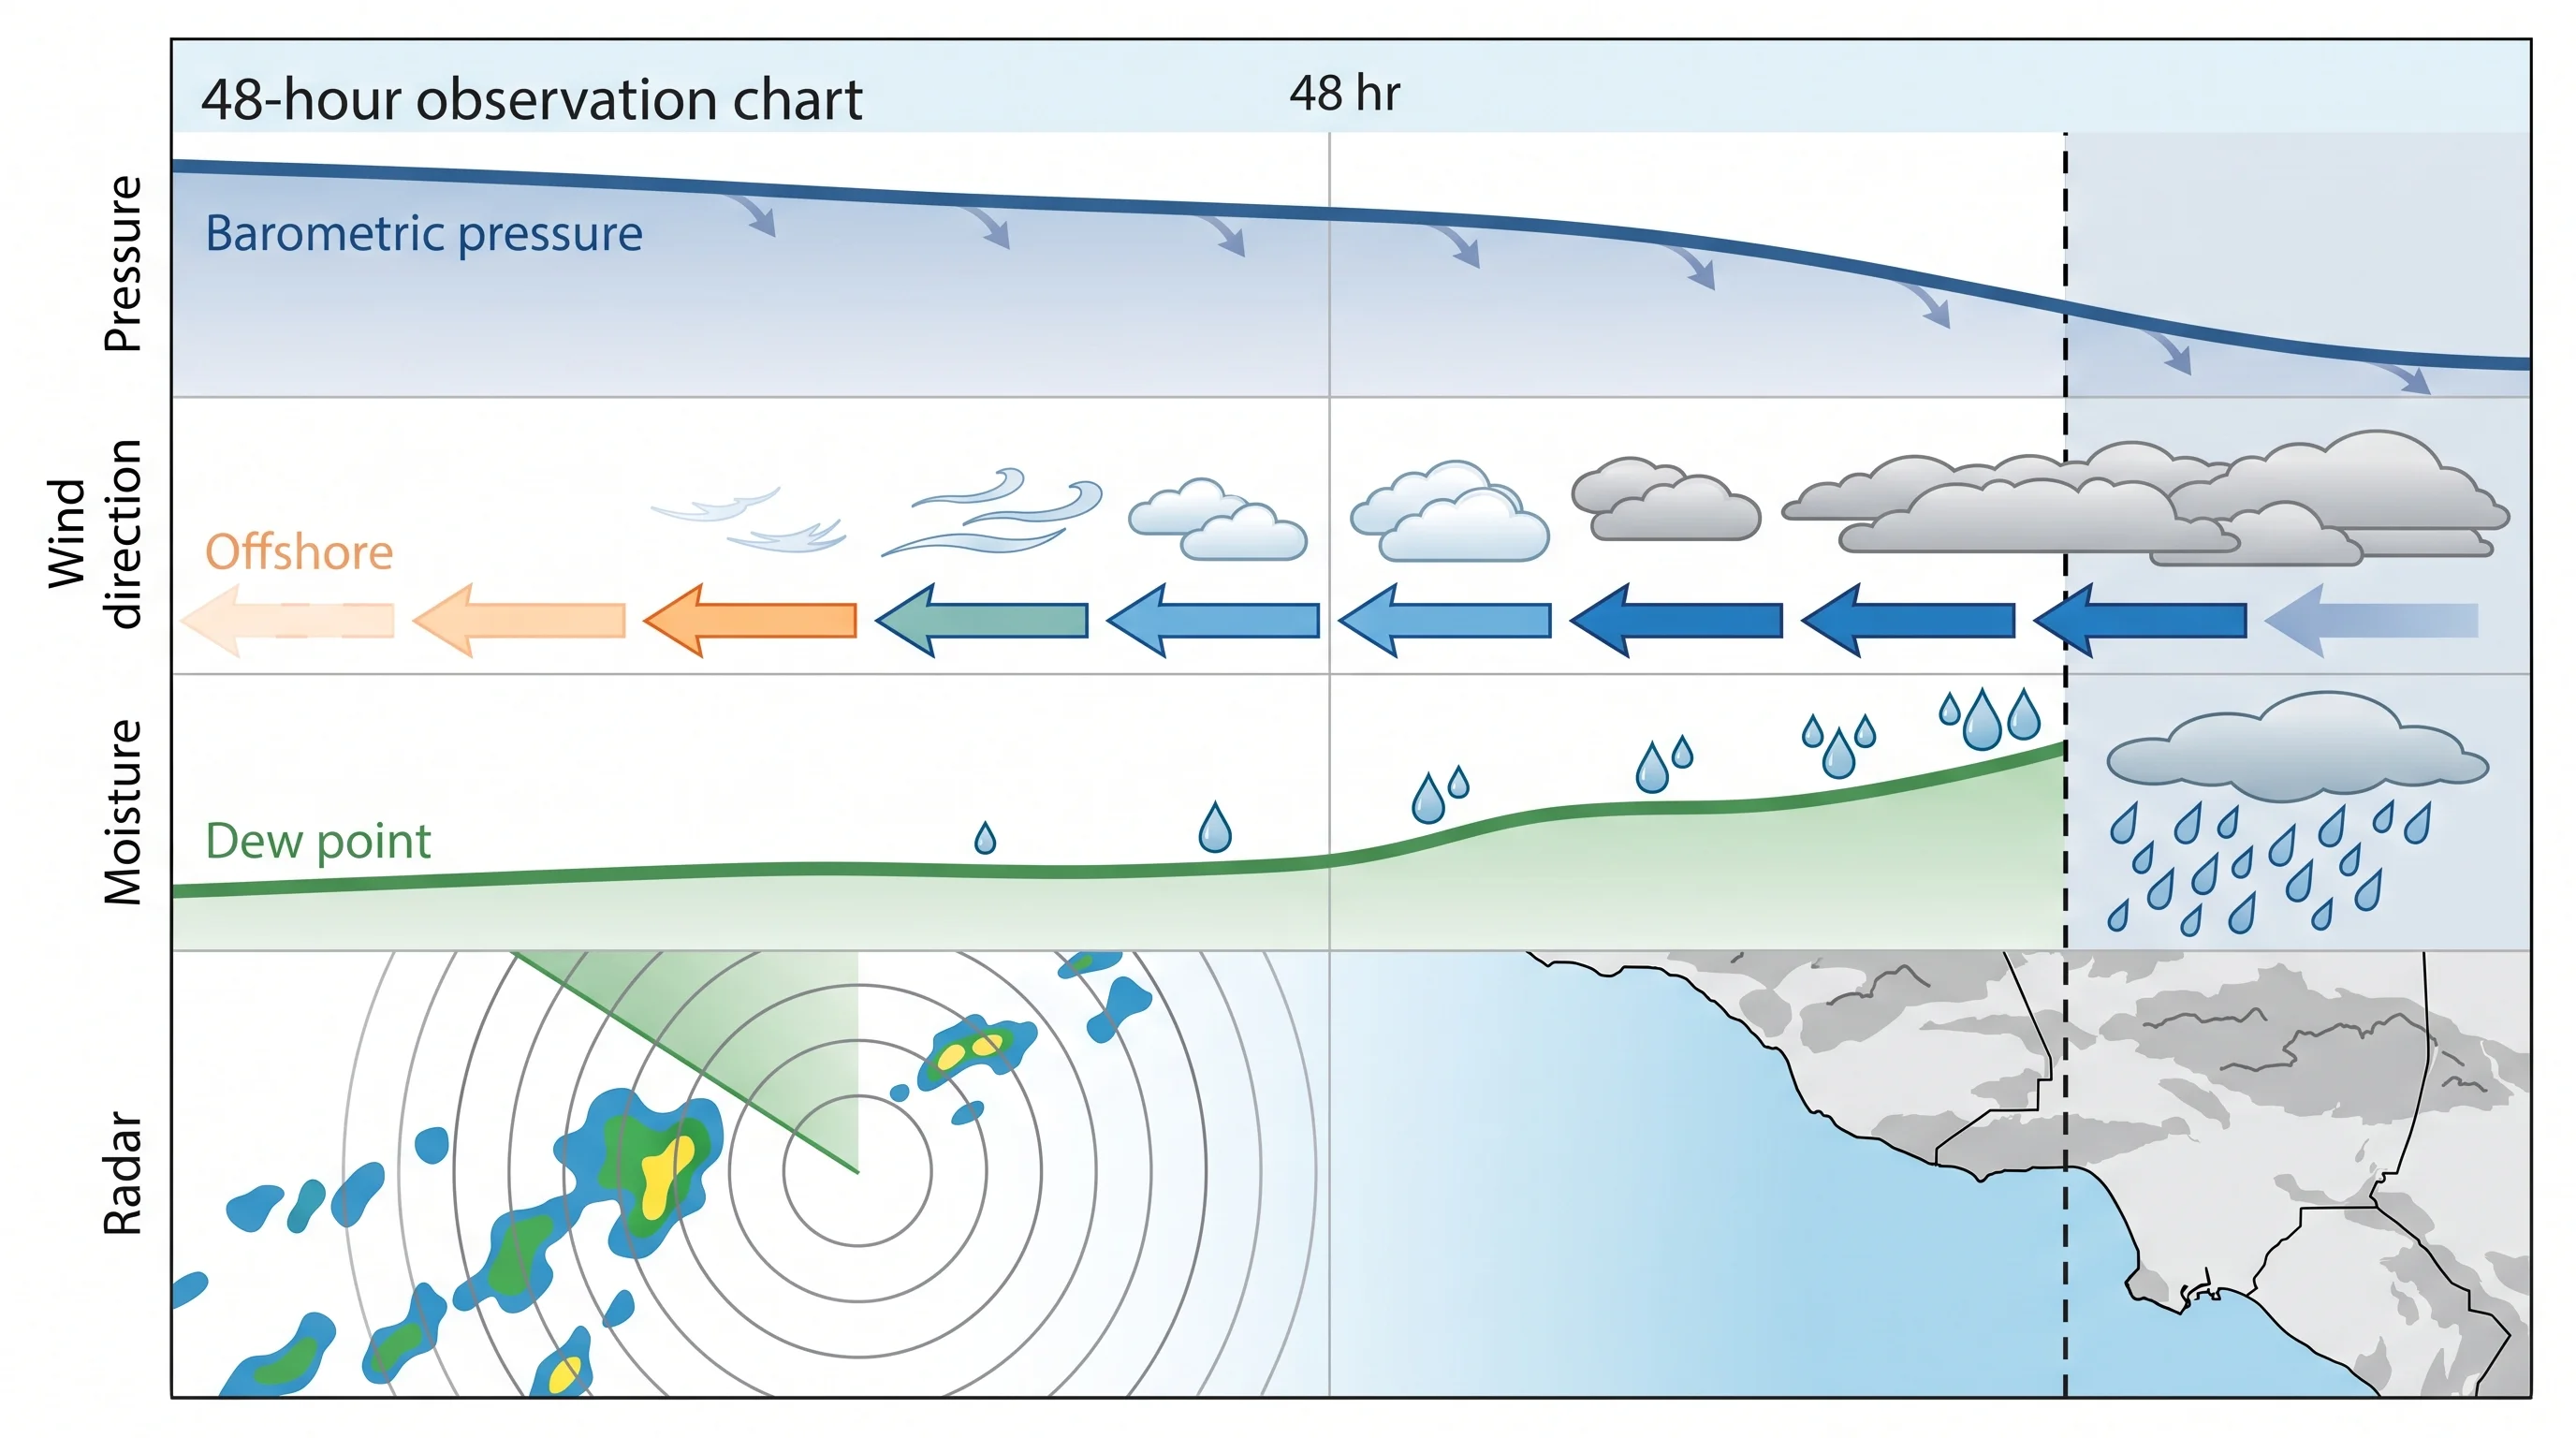
Pressure alone cannot reliably predict rain. Forecasters at NWS Los Angeles/Oxnard and NWS San Diego combine pressure and its trend with wind direction, dew point and moisture, satellite cloud images and radar before issuing a forecast. Pressure alone cannot tell a moist, rainy low from a dry, wind-only trough. Treat a falling barometer as a reason to check those other sources, not as a rain forecast.
Whether pressure changes cause physical symptoms, most often joint pain, headaches or migraines, has no settled answer. The idea is plausible: pressure changes could affect sensitive tissue around joints or trigger blood vessel changes linked to headaches. Studies disagree. Some find a modest link between pressure changes and reported joint pain or migraines in certain groups, while others, including careful symptom-tracking studies, find no consistent link.
No research has shown that a given pressure drop reliably causes a given symptom in the general population. People who notice their own pattern are describing a real experience, but it is not a proven universal rule.
How Should You Use a Pressure Trend in Los Angeles?
Use a falling barometer in Los Angeles as a cue to check the official forecast, not as the forecast itself. Compare your trend with the surface analysis, forecast discussion and timing from NWS Los Angeles/Oxnard or NWS San Diego, depending on your location.
Check whether the wind has turned onshore, whether the dew point is rising and whether satellite shows an organized storm approaching. For storms carrying subtropical moisture, see Pineapple Express storms. For Southern California's summer rain source, see the SoCal desert monsoon.
A steadily falling barometer is a real signal; it warned sailors, farmers and forecasters of storms for centuries before satellites. In Los Angeles, treat it as forecasters do: one input that calls for a closer look at the NWS surface map, wind shift and rain timing, never a guarantee. Check Downtown Los Angeles, Pasadena or any WeatherLA Los Angeles destination page for the pressure trend and full forecast before deciding how a storm will affect your plans.